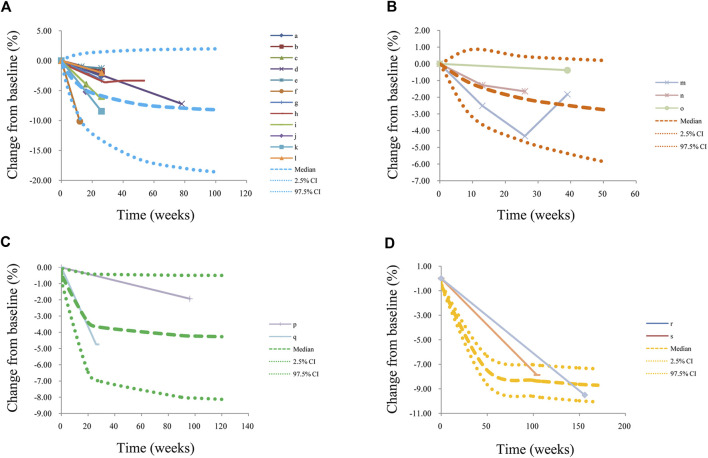
FIGURE 3.
Prediction-corrected visual predictive check plots. (A) patients with obesity, (B) patients with type 1 diabetes mellitus, (C) patients with nonalcoholic fatty liver, and (D) patients with precocity. Median, 2.5% CI, and 97.5% CI were simulated by Monte Carlo (n = 1,000); CI; a, Pastor-Villaescusa et al. (2017); b, Pastor-Villaescusa et al. (2017); c, Garibay-Nieto et al. (2017); d, van der Aa et al. (2016); e, Kendall et al. (2013); f, Gómez-Díaz et al. (2012); g, Yanovski et al. (2011); h, Wilson et al. (2010); i, Clarson et al. (2009); j, Burgert et al. (2008); k, Atabek and Pirgon (2008); l, Love-Osborne et al. (2008); m, Nwosu et al. (2015); n, Nadeau et al. (2015); o, Codner et al. (2013); p, Lavine et al. (2011); q, Nadeau et al. (2009); r, Ibáñez et al. (2006a); s, Ibáñez et al. (2006b).

