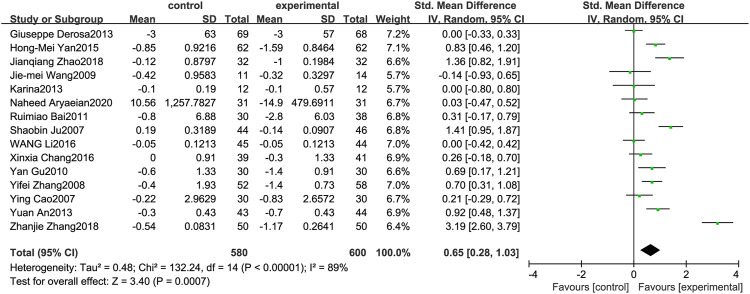
FIGURE 8.
Meta-analysis and migration analysis of the effect of berberine on fasting plasma glucose. Forest plot illustrates the differences in changes in fasting plasma glucose in adults with metabolic disease who did or did not receive berberine in 13 trials (n = 1,052). The mean difference (blue squares), 95% CI (horizontal lines through blue squares), and pooled-effect sizes (green diamonds) were presented using random-effect Hedges models.

