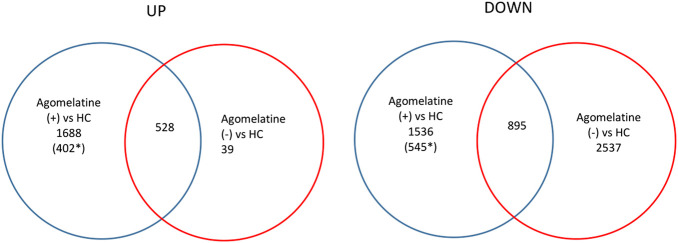
FIGURE 4.
Venn diagrams representing unique and shared differential gene expression profiles of agomelatine (+) & (−) patients, numbers of genes upregulated (UP) and downregulated (DOWN), blue ring—number of genes uniquely up- or downregulated in agomelatine (+), and red ring—number of genes uniquely up- or downregulated in agomelatine (−). Overlapping parts of the diagram—the number of shared genes uniquely up- or downregulated between groups of patients. (For interpretation of the references to color in this figure legend, the reader is referred to the Web version of this article.) *functionally known by the DAVID/KEGG database.

