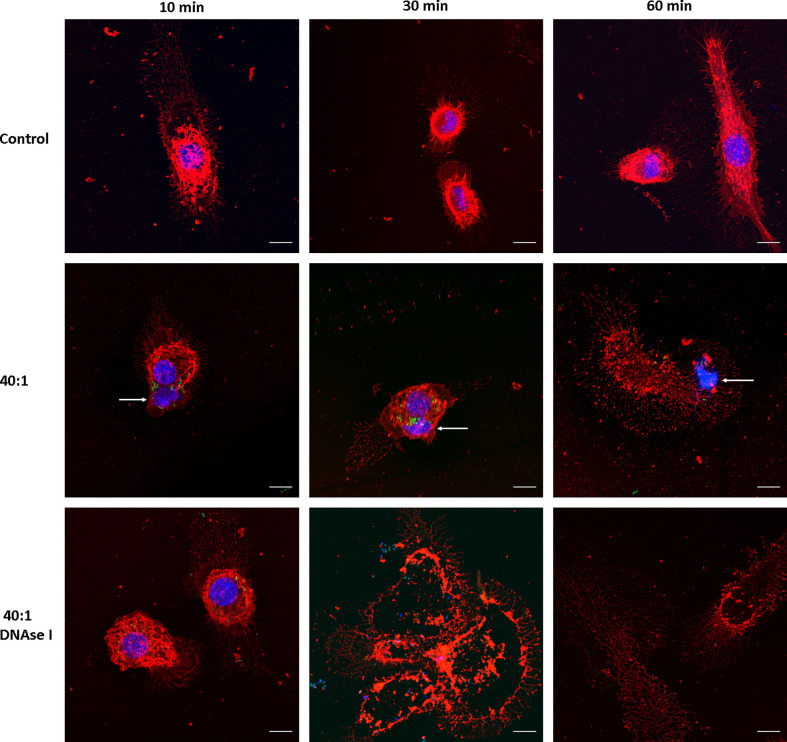
Figure 2.
MET release after Salmonella infection. Confocal microscopy images of J774A.1 macrophage extracellular trap release at t = 10, 30, and 60 min. Upper row: Uninfected cells (Control). Central row: Cells infected with Salmonella enterica serovar Typhimurium LVR01 (40:1). Bottom row: Cells infected with LVR01 pretreated with DNAse I. Maximum intensity z-projections are shown for membrane visualization with WGA staining (red), DNA (blue), and Salmonella (green). The arrows point out MET release. The scale bar represents 10 µm.

