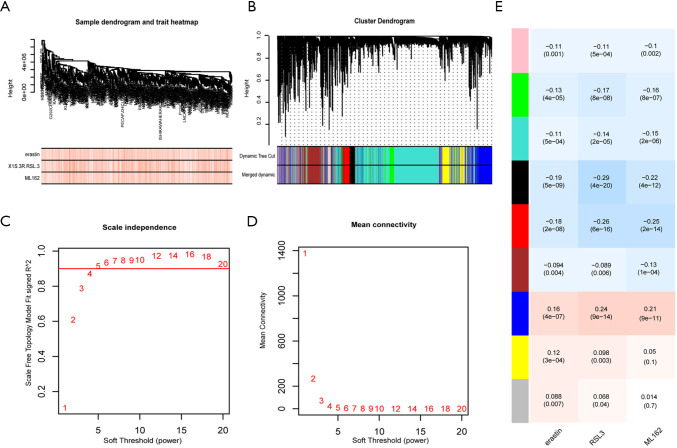
Figure 2.
WGCNA analysis was used to screen the key gene modules correlated with ferroptosis sensitivity. (A). The samples were clustered with the expression data of 18,543 genes in 659 tumor cell lines, and the outlier samples were excluded. (B) The gene clustering tree (tree view) is obtained from the hierarchical clustering of adjacency correlation, and the color rows below the tree represent the gene modules identified by the dynamic cutting tree method. (C) The scale-free index is calculated under different soft thresholds. (D) The average connectivity is calculated at different soft thresholds. (E) The correlation between each gene module and different ferroptosis inducer AUC value; each row represents the module’s characteristic gene. Each column represents the different ferroptosis inducer AUC value; the corresponding correlation value of the first behavior in each cell, the second behavior P value; the redder the cell color is, the more positive the correlation is, and the bluer the cell color is, the more negative the correlation is.

