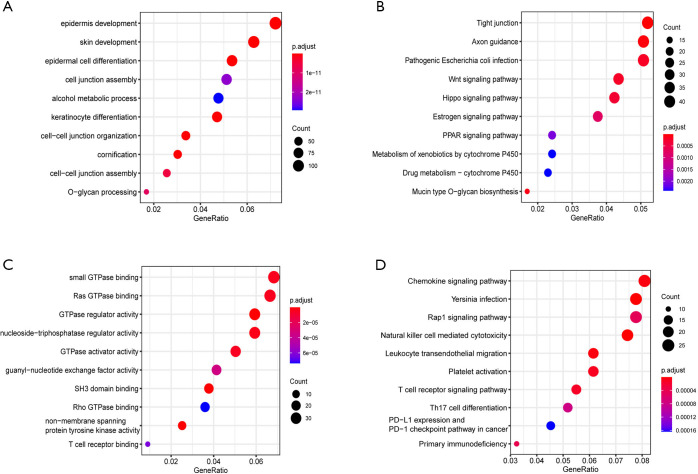
Figure 3.
Gene enrichment analysis of black module and blue module. (A) Blue module GO enrichment analysis results. (B) Blue module KEGG enrichment analysis results. (C) Black module GO enrichment analysis results. (D) Black module KEGG enrichment analysis results. The dot size shows the number of genes, the Y-axis is the enriched pathway in GO and KEGG analysis, and the legend’s color is marked according to the corrected P value. GO, Gene Ontology; KEGG, Kyoto Encyclopedia of Genes and Genomes.

