Figure 4.
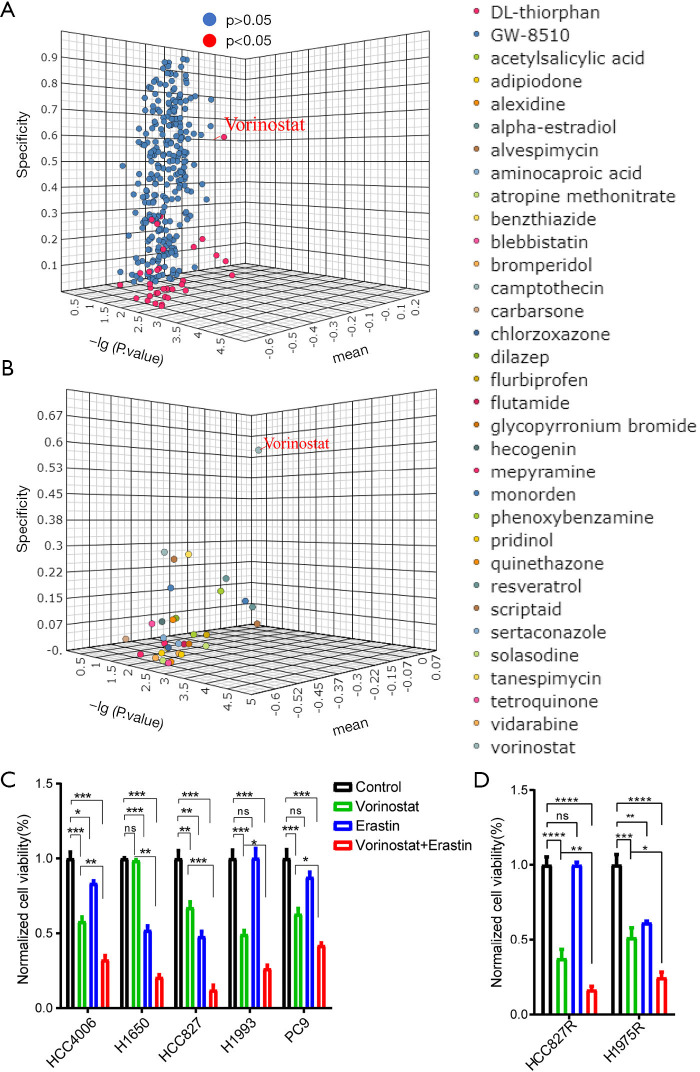
The drugs reversing ferroptosis resistance were screened by Connectivity Map, and the inhibitory effect of the selected drugs on cell proliferation was verified by cytotoxicity test. (A) Three-dimensional scatter map. The drugs with P<0.05 were marked red, and those with P>0.05 were marked blue. (B) Taking P<0.05 as the criterion for judging the significant effect of drugs, a total of 33 drugs were selected. Among them, Vorinostat has the highest specificity (specificity =0.618). (C) HCC4006, H1650, HCC827, H1993, PC-9 cells were divided into control group, Erastin (1 µM) group, Vorinostat group (HDAC inhibitor, 1 µM) and combination group (1 µM Vorinostat and 1 µM Erastin). The number of cells was counted after 48 hours of drug treatment, and the number of cells in different treatment groups was compared by one-way ANOVA test and Bonferroni method. (D) HCC827R and H1975R cells were divided into blank control group, Erastin (1 µM) group, Vorinostat group (HDAC inhibitor, 1 µM), and combination group (1 µM Vorinostat and 1 µM Erastin). The number of cells was counted after 48 hours of drug treatment, and the number of cells in different treatment groups was compared by one-way ANOVA test and Bonferroni method. *, P<0.05; **, P<0.01; ***, P<0.001; ****, P<0.0001. HDAC, histone deacetylase; ANOVA, analysis of variance.

