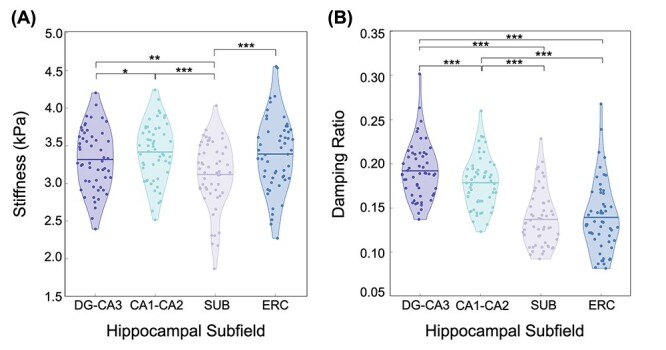
Figure 3.

Individual HCsf viscoelasticity as quantified by (A) μ and (B) ξ for DG-CA3 (dark purple), CA1-CA2 (light blue), SUB (light purple), and ERC (dark blue). Individual subject μ and ξ values are indicated by the dots on both plots, whereas the mean value for each subfield is indicated by the solid horizontal lines on each plot. Post hoc tests with Bonferroni correction were performed to determine significant individual differences between the subfield pairs (*: P < 0.05; **: P < 0.01; ***: P < 0.001).
