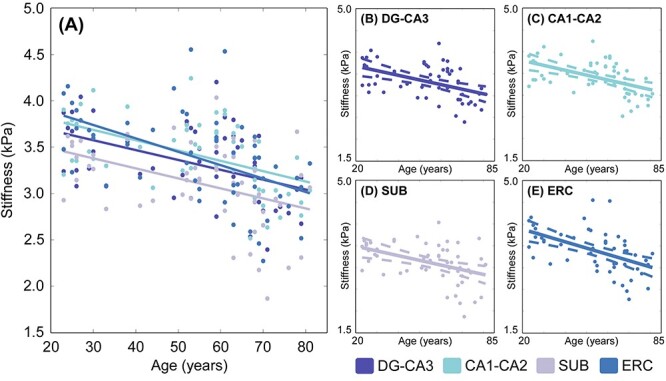
Figure 4.

(A) Relationship between age and HCsf μ. (B–E) Individual plots for each HCsf region for μ with 95% confidence interval boundaries around the slope. There is a significant linear negative relationship between μ and age (P < 0.001) across allHCsf.
