
Figure 2.
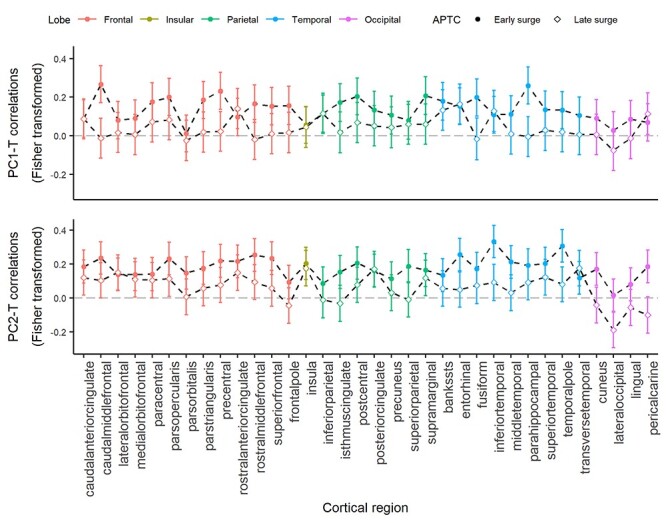
Inter-regional profiles of Fisher-transformed correlation coefficient between pubertal testosterone and brain cortex variables PC1 and PC2 in the early and late surge group. Dashed lines with solid circles represent profiles of the early surge group, dashed lines with the empty square are profiles of the late surge group. Error bar represents ±1 SD of correlation coefficients.