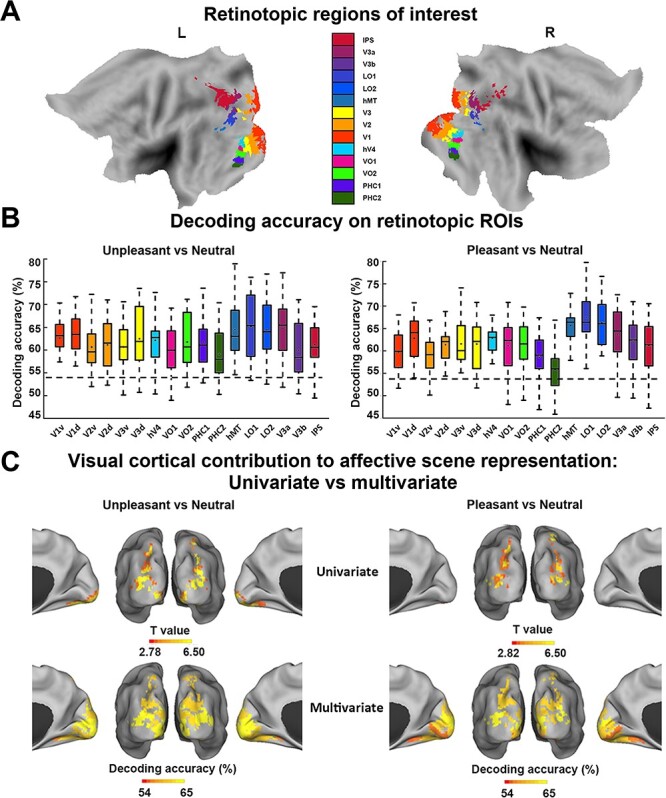
Figure 3.

MVPA decoding analysis of neural representations of emotional scenes in retinotopic visual cortex. (A) Retinotopic ROIs visualized on the flattened brain. (B) Group average decoding accuracy between unpleasant versus neutral and pleasant versus neutral in different ROIs. Dashed line indicates the statistical significance threshold (54%). (C) Comparison between visual cortical contribution to the representation of affective scenes revealed by (top) univariate activation analysis (data from Fig. 2A,B replotted here) and by (bottom) multivariate decoding from B.
