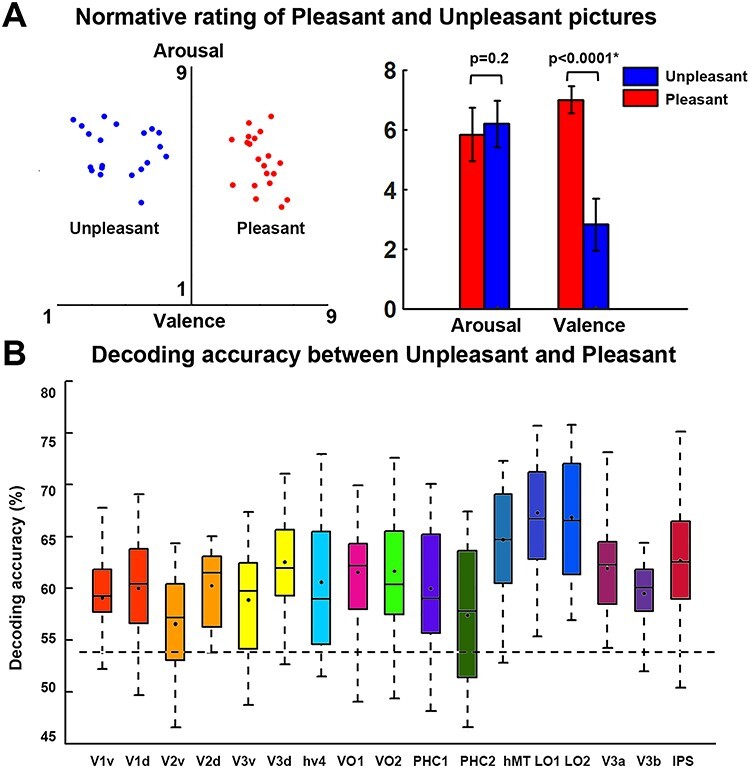
Figure 4.

MVPA decoding of pleasant versus unpleasant scenes. (A) Normative valence and arousal ratings of unpleasant and pleasant images used in this study. The error bar depicts the standard error of the mean for the normative ratings of 20 pictures in one category. Arousal is not significantly different between the two classes of pictures, whereas pleasant pictures have significantly higher valence than unpleasant pictures. (B) Group average decoding accuracy between unpleasant and pleasant in retinotopic ROIs. Dashed line indicates the statistical significance threshold (54%) at P < 0.001 according to a random permutationtest.
