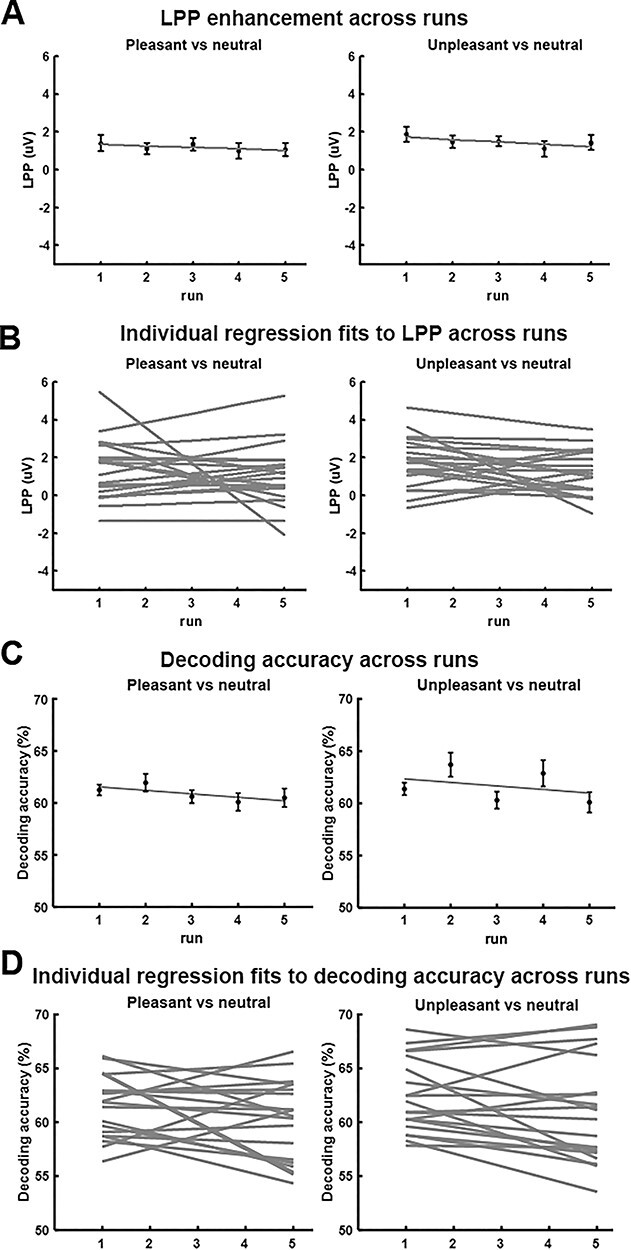
Figure 7.

Effects of picture repetition. (A) LPP enhancement as a function of run. (B) Linear fits to LPP as a function of run for each individual participant (n = 20). The slopes were not significantly different from zero (P = 0.51 for pleasant vs. neutral and P = 0.17 for unpleasant vs. neutral). (C) Decoding accuracy as a function of run. (D) Linear fits to decoding accuracy as a function of run for each individual participant (n = 20). The slopes were not significantly different from zero (P = 0.16 for pleasant vs. neutral and P = 0.07 for unpleasant vs. neutral).
