
FIGURE 5.
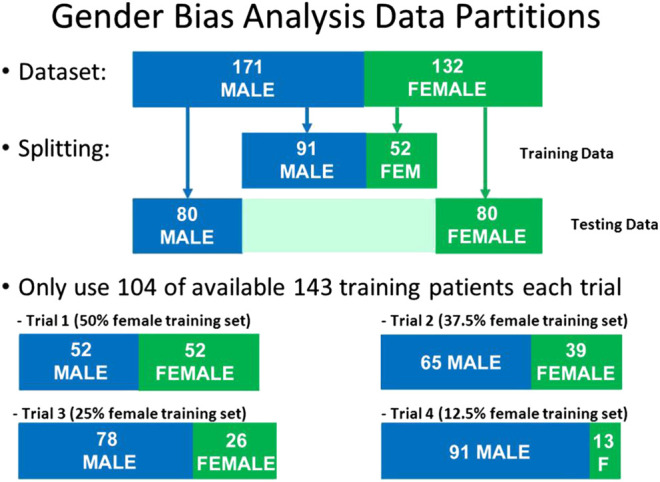
Data partitions used for Gender Bias analysis. The size of the test set and the size of the training set were kept constant, but the proportion of males and females was varied in the training set.
Official websites use .gov
A
.gov website belongs to an official
government organization in the United States.
Secure .gov websites use HTTPS
A lock (
) or https:// means you've safely
connected to the .gov website. Share sensitive
information only on official, secure websites.
Data partitions used for Gender Bias analysis. The size of the test set and the size of the training set were kept constant, but the proportion of males and females was varied in the training set.