
FIGURE 8.
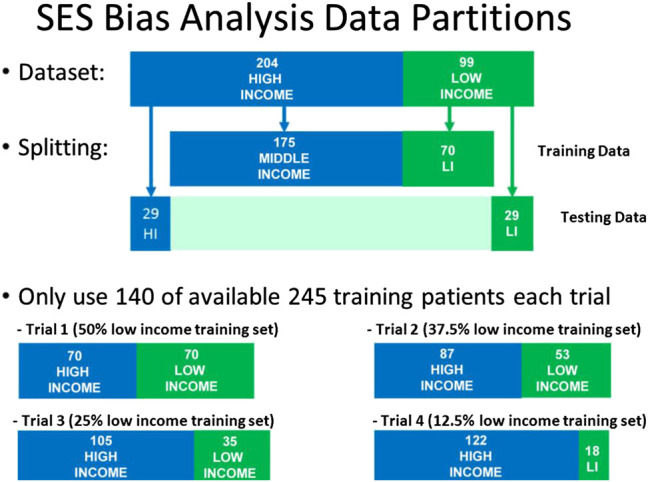
Data partitions used for Socio-Economic (SES) bias analysis. The size of the test set and the size of the training set were kept constant, but the proportion of low-SES vs high-SES was varied in the training set.
Official websites use .gov
A
.gov website belongs to an official
government organization in the United States.
Secure .gov websites use HTTPS
A lock (
) or https:// means you've safely
connected to the .gov website. Share sensitive
information only on official, secure websites.
Data partitions used for Socio-Economic (SES) bias analysis. The size of the test set and the size of the training set were kept constant, but the proportion of low-SES vs high-SES was varied in the training set.