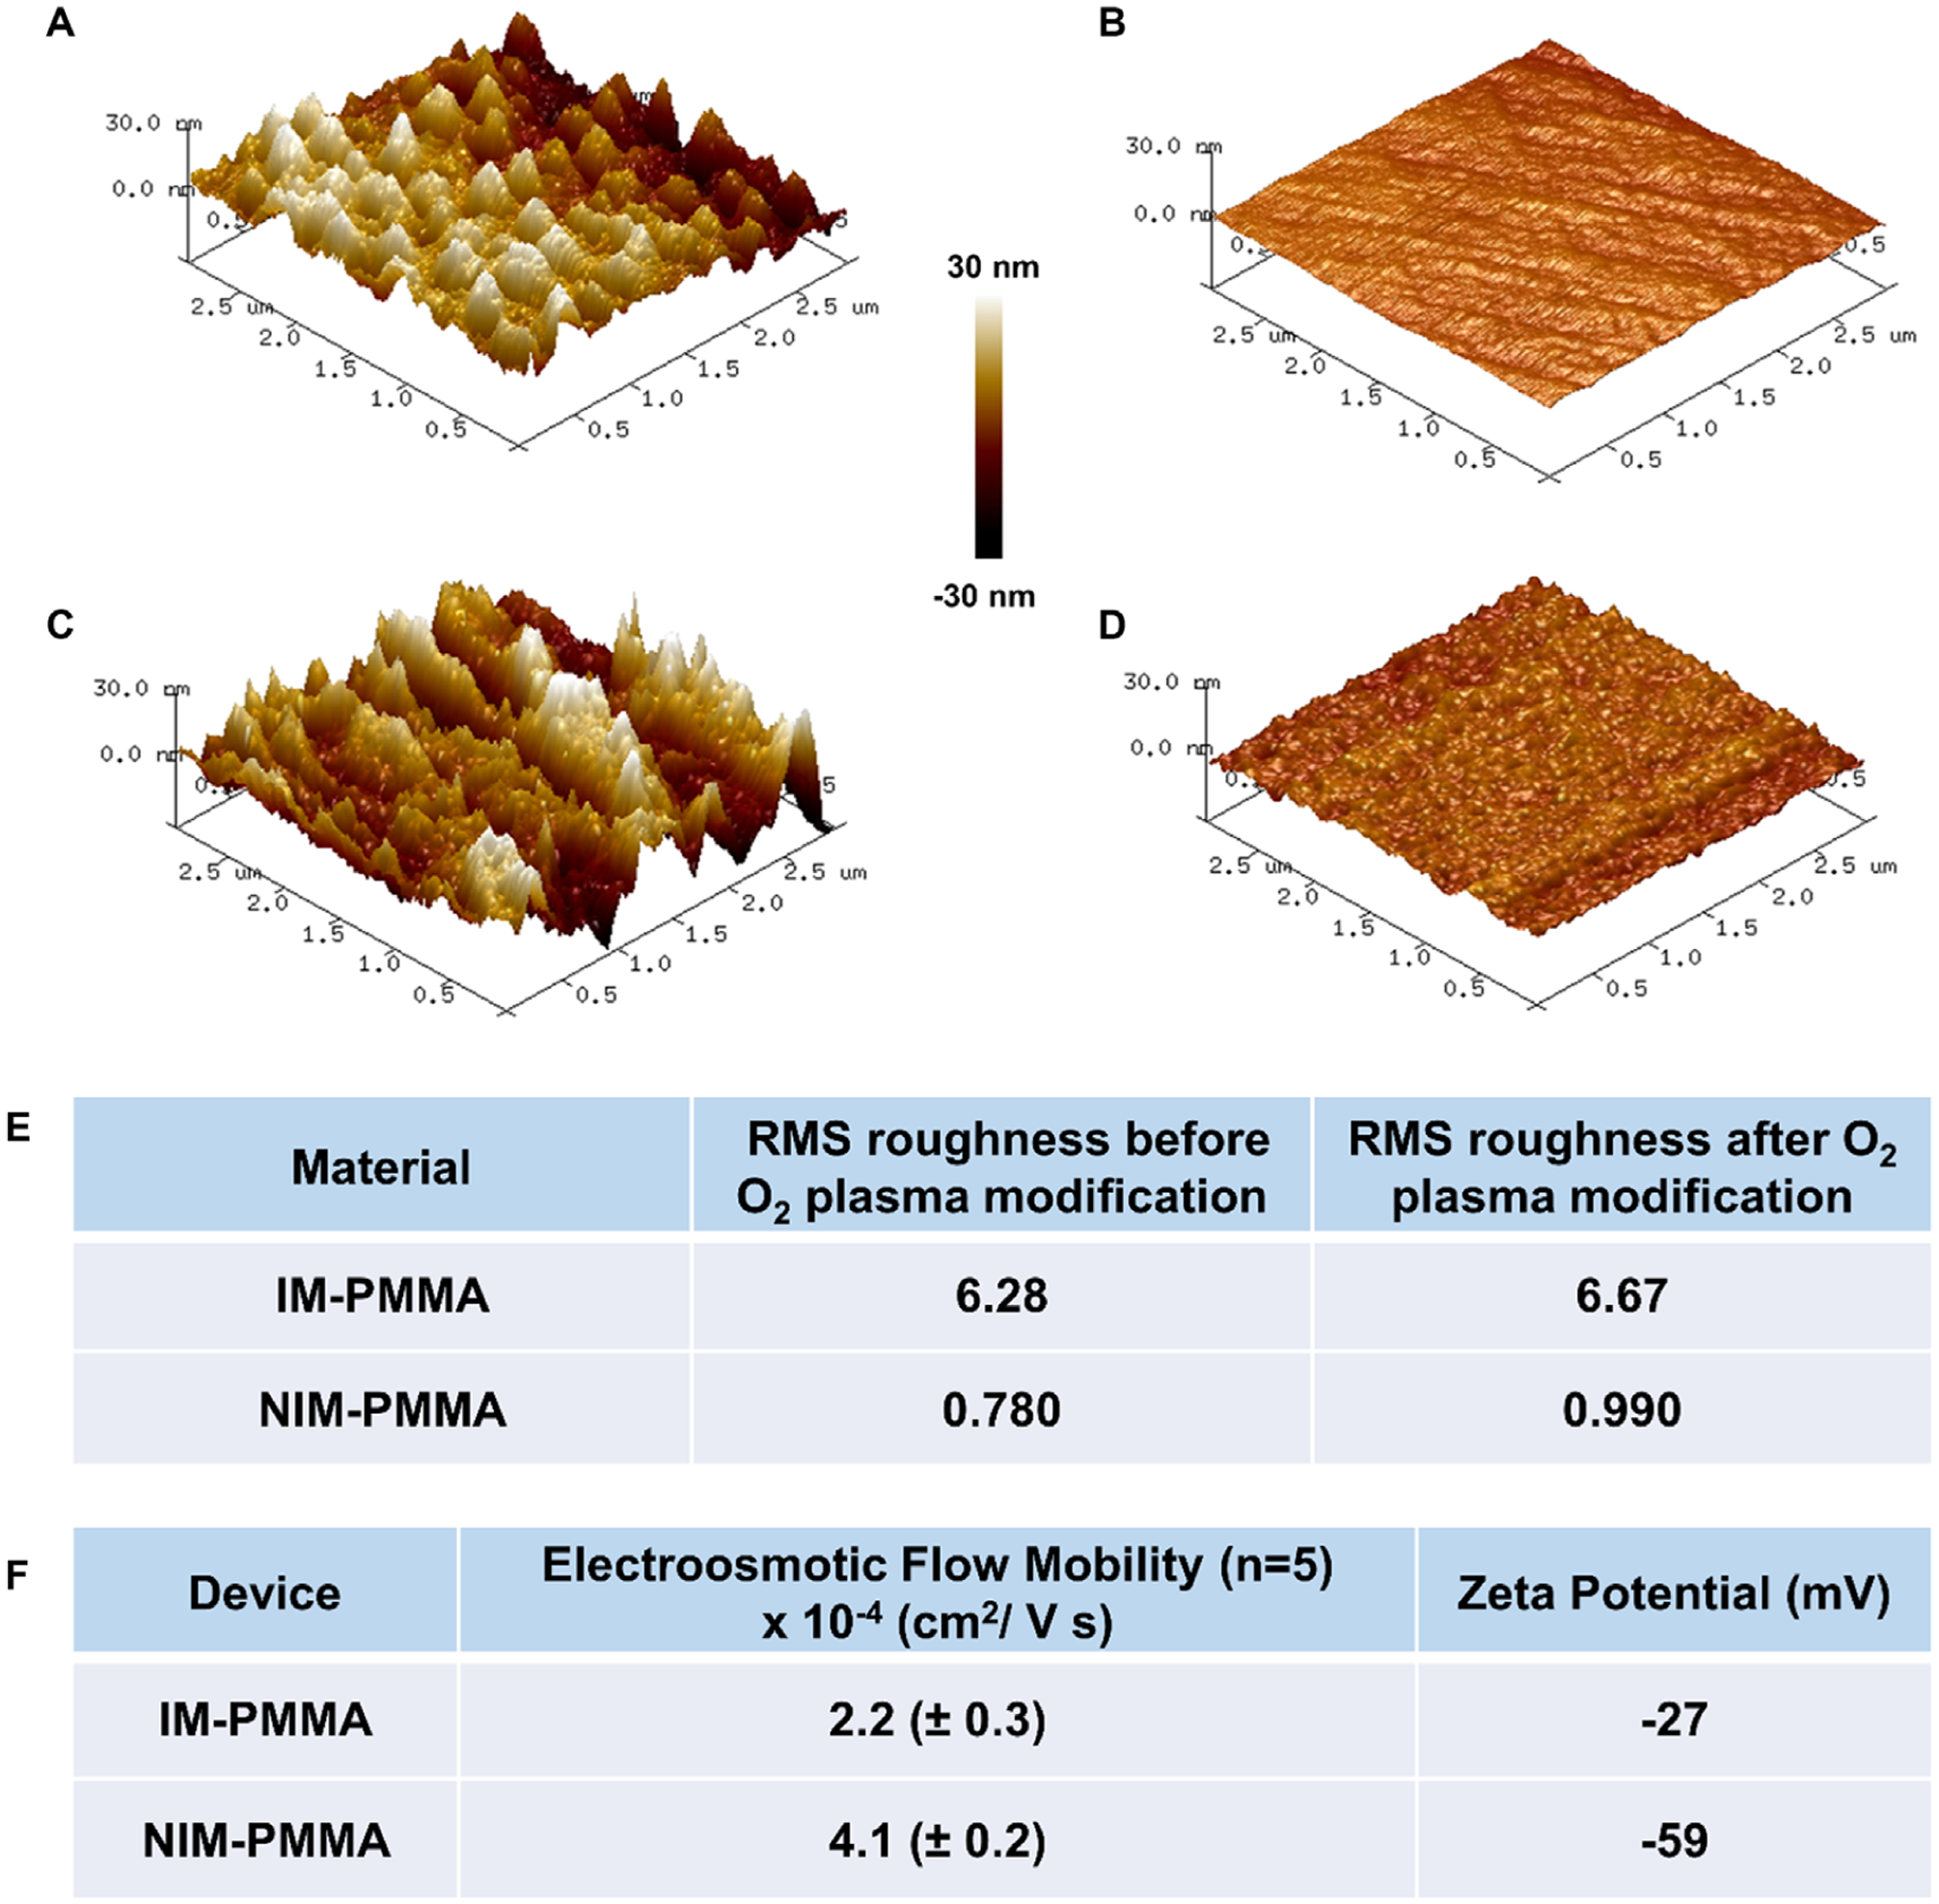
Figure 4.

Characterization of surface roughness by AFM for IM-PMMA and NIM-PMMA surfaces before and after O2 plasma activation. Shown are AFM images of: (A) IM-PMMA; (B) NIM-PMMA; (C) O2 plasma treated IM-PMMA; and (D) O2 plasma treated NIM PMMA. Plasma activation was done at 50 mW for 1 min. These images were taken by scanning an area of 3 μm × 3 μm. (E) Comparison of the measured root mean square (RMS) roughness of both PMMA types before and after O2 plasma activation. (F) The measured EOF for NIM-PMMA and IM-PMMA nanochannel devices as well as the zeta potential following O2 plasma activation (EOF measured at pH = 8.3).
