
Figure 6.
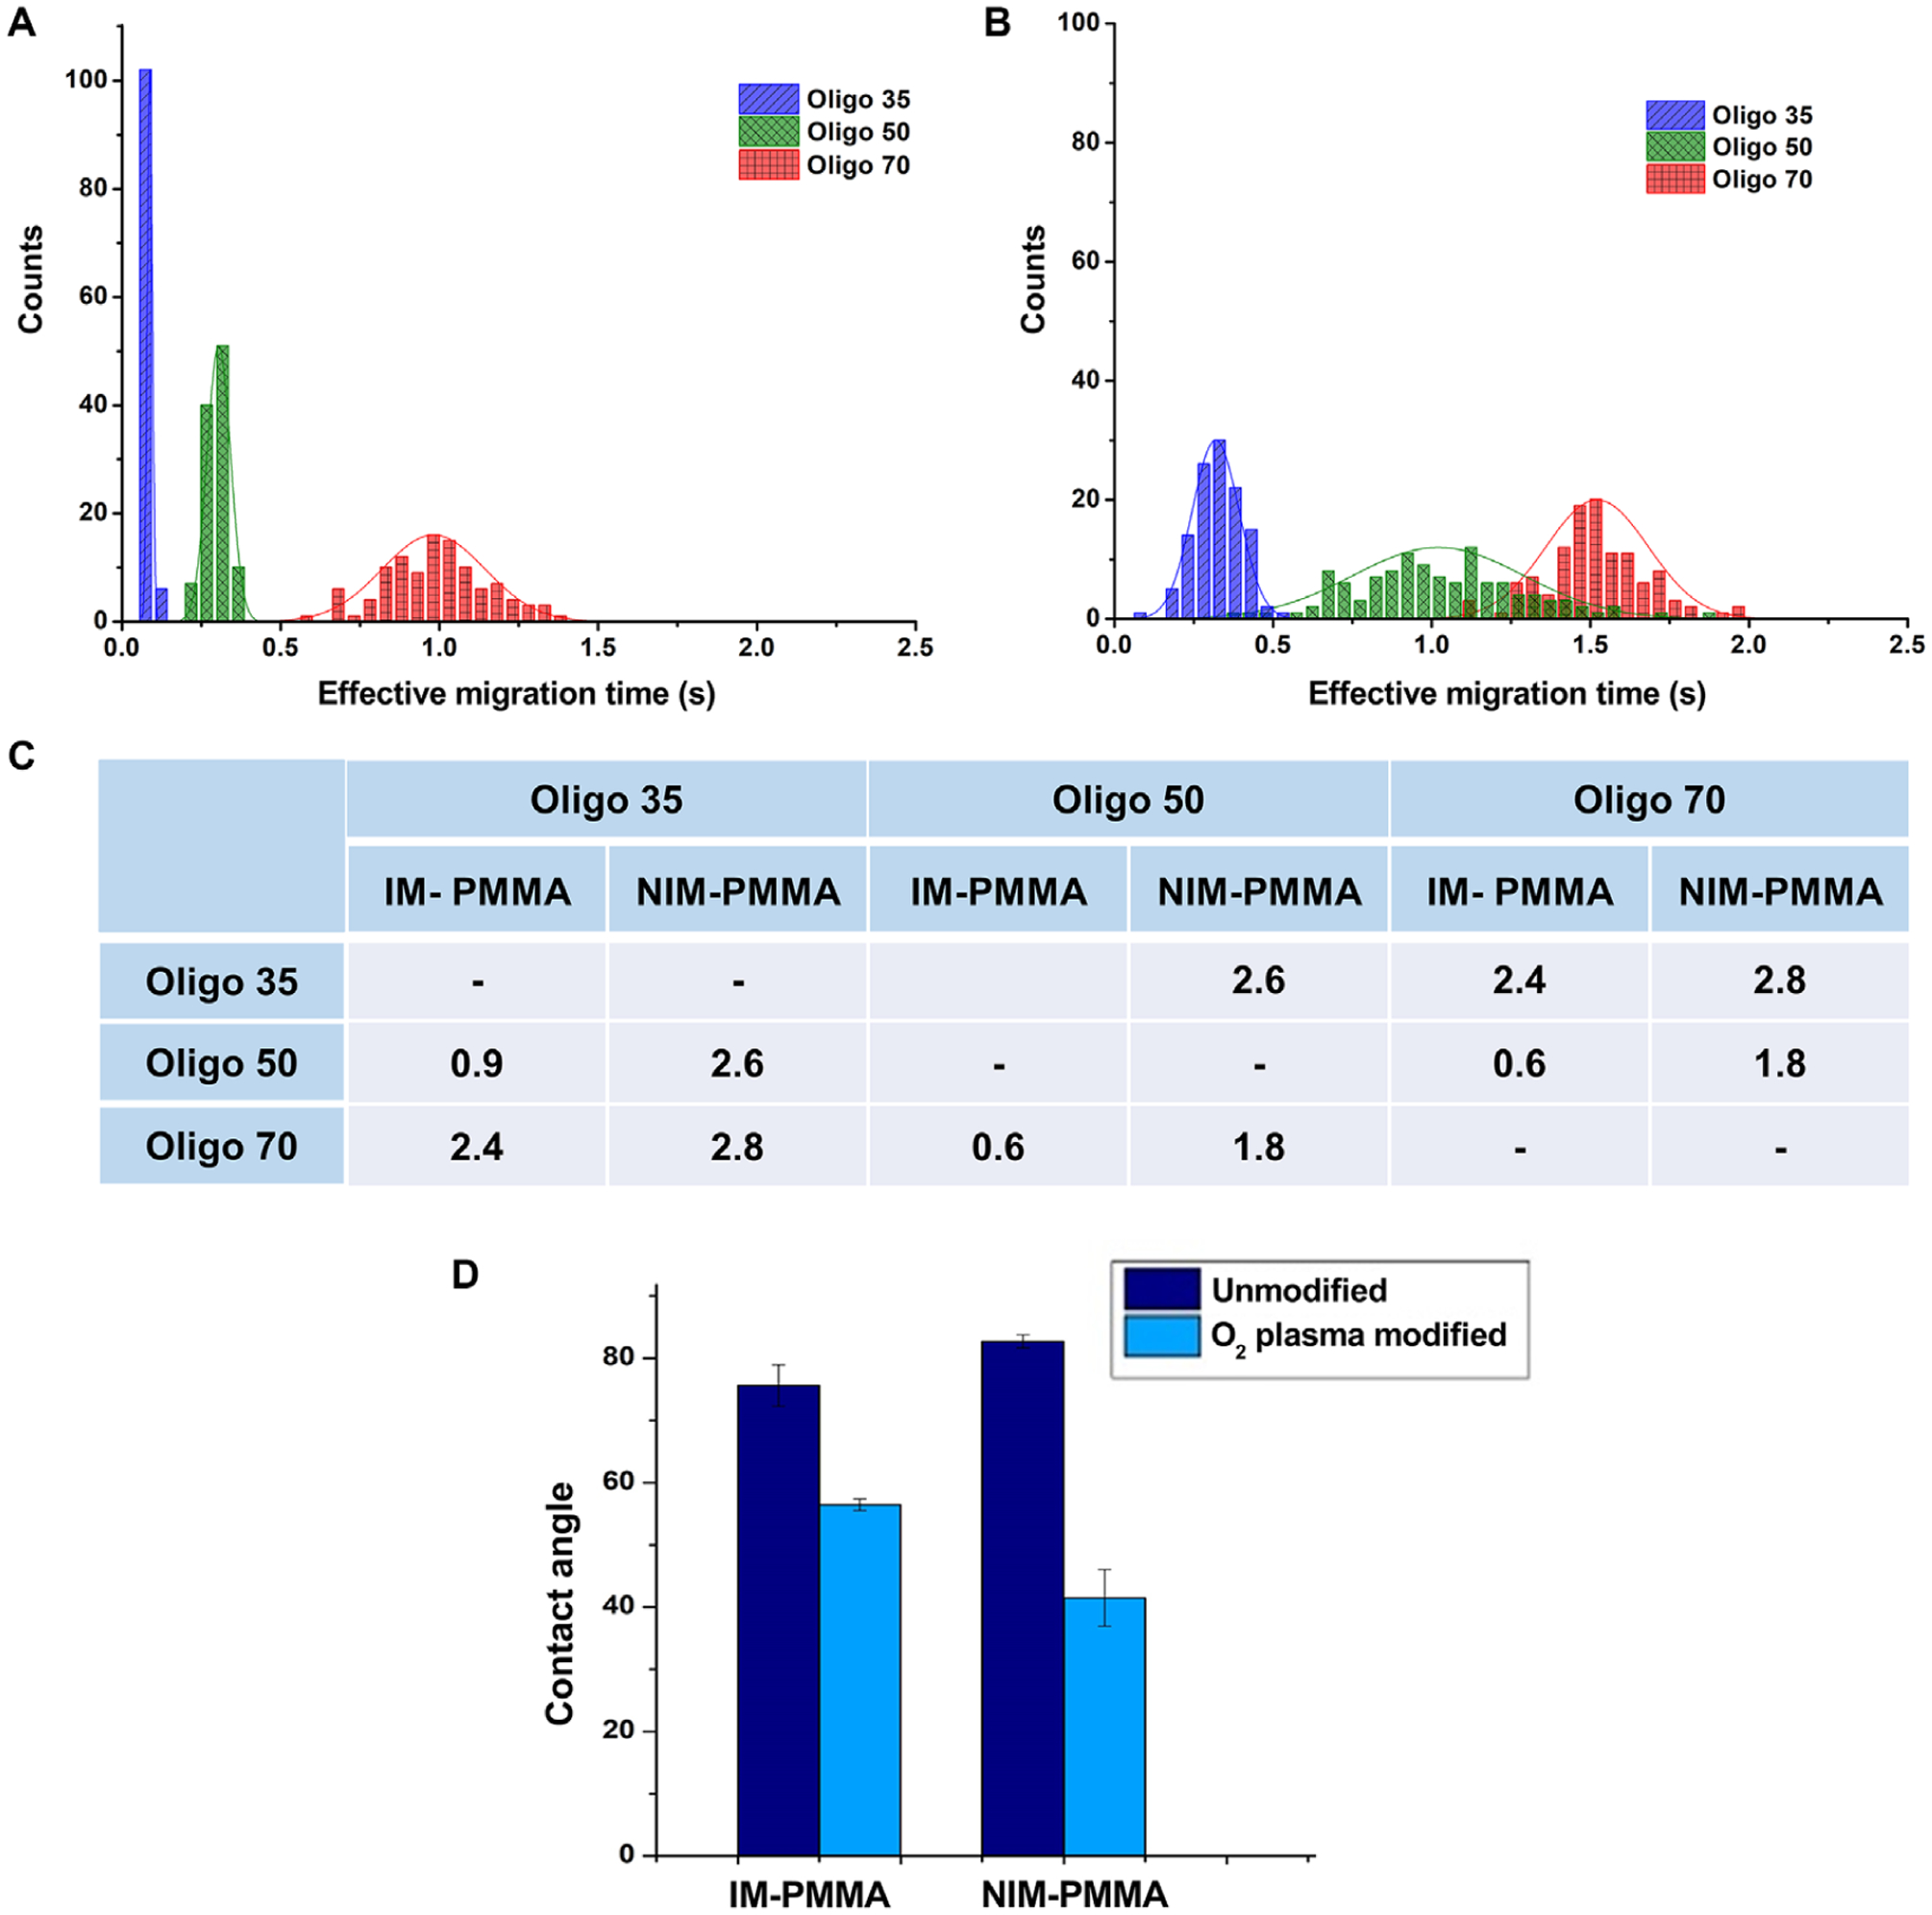
(A) Histogram of effective migration time of Oligo 35, Oligo 50 and Oligo 70 at an electric field strength of 280 V/cm that were separated in NIM-PMMA-COC8007 device. (B) Histogram of effective migration time of Oligo35, Oligo50 and Oligo70 at a field strength of 280 V/cm that were separated in IM-PMMA-COC 8007 device. Histograms were fitted in to a Gaussian distribution and each bin represent 0.05 s for n = 100 events. (C) Calculated separation resolution between the 3 ssDNA. (D) Contact angle of IM-PMMA and NIM-PMMA before and after oxygen plasma modification.