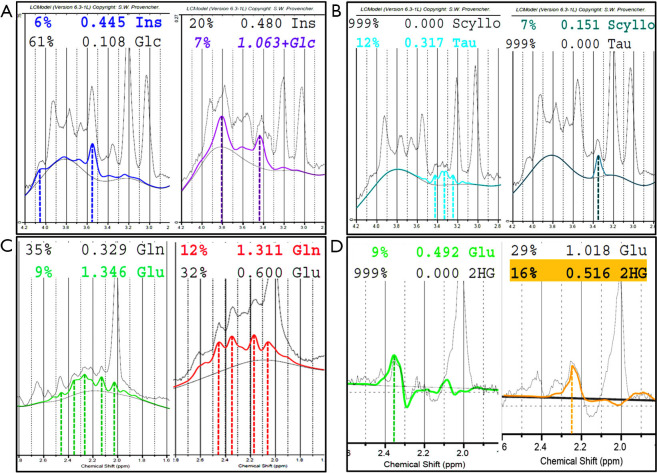
Figure 4.
Various examples of the usefulness of advanced post-processing analysis methods (“LCModel” version 6.3-1L, Stephen Provencher Inc., Oakville, ON, Canada; SVS): the experimental data are fit as a linear combination of spectra of pure compounds recorded under the same experimental conditions as the in vivo spectrum; an estimate of metabolite concentrations is provided relative to the brain water signal and to Cr1 signal; the contribution of each metabolite to the spectrum is indicated by the coloured lines. Metabolites names with an estimated uncertainty of less than 20% (most commonly used statistical cut-off for a reliable peak assignation) are labeled in colour. In cases (A,B,C) examples of short TE PRESS spectra recorded at 1.5T are shown: in (A) myo-Inositol (Ins, left) from a normal subject, and Glucose (Glc, right) in a patient with diabetic ketoacidosis; in (B) taurine mutiplet (Tau, left), and scyllo-Inositol singlet (Scyllo, right) signals recorded respectively in normal 18-month-old and 6-year-old subjects; in (C) Glutamate (Glu) and Glutamine (Gln) complex multiplet signals respectively in a normal age-matched subject (prevalence of Glu, left) and in a 4-year-old female (prevalence of Gln, right) with hyperammoniemic encephalopathy. In (D) an optimized 97 ms PRESS sequence acquired at 3 Tesla shows the possible differentiation of Glu (~2.35 ppm, left) and 2-hydroxyglutarate (2HG, 2.25 ppm, right) signals for IDH-mutated gliomas identification. Acronyms and abbreviations are shown in Appendix 1.

