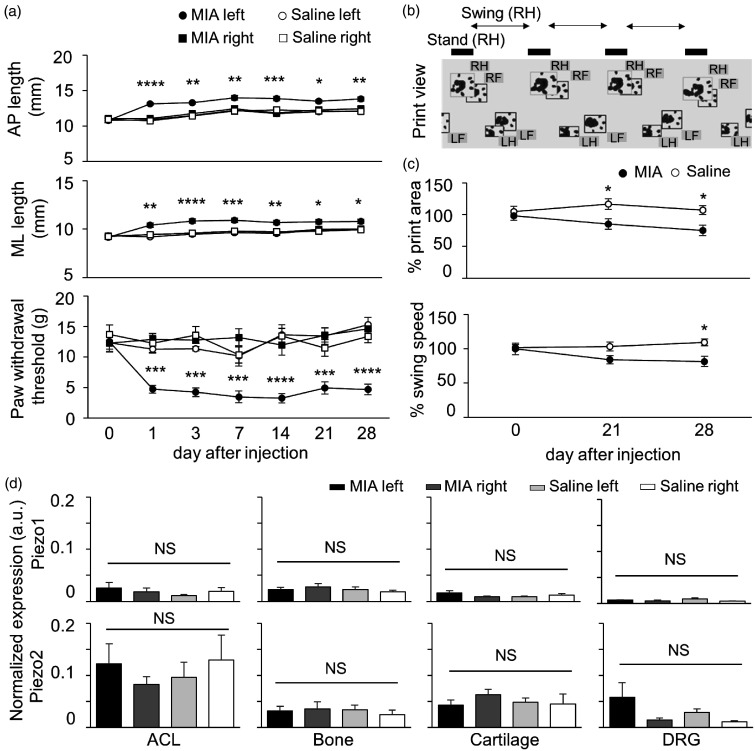
Figure 1.
Piezo mRNA expression level in the rat model of osteoarthritis. (a) Summary of the knee joint changes and mechanical sensitivity in the model of osteoarthritis induced by injection of monosodium iodoacetate (MIA). Top and middle panels show anterior–posterior (AP) and medial–lateral (ML) length of the knee joint during the development of arthritis, respectively. The lowest panel shows a summary of paw withdrawal threshold in the rat model of osteoarthritis. Filled and open circles indicate the responses ipsilateral (left) to MIA and saline injection, respectively. Filled and open squares indicate the response contralateral (right) to MIA and saline injection, respectively. The values before injection were measured at day 0 after injection. Mean values ± standard error of the mean (SEM). *P < 0.05; **P < 0.01; ***P < 0.001 ****P < 0.0001 vs. saline left and non-injected knees (two-way ANOVA followed by a Bonferroni post hoc test). (b) Analysis of gait of rats treated to produce a model of osteoarthritis. This panel shows the print view of each paw, which was captured by CatWalk system. RH, LH, RF, and LF indicate right hind, left hind, right front, and left front, respectively. Stand (RH) and Swing (RH) show the duration in contact and no contact of a right hind paw on the glass plate, respectively. (c) Gait analysis was obtained by comparing values for the hind paw (LH) ipsilateral to the treatment to normalized values for the hind paw (RH) contralateral to the treatment. Top and bottom panel shows the ratio of print area and swing speed at each examination day. Filled and open circles indicate rats from the MIA- and saline-treated groups, respectively. Mean values ± SEM. *P < 0.05 vs. saline treated group (two-way ANOVA followed by a Bonferroni post hoc test). (d) Normalized expression levels of Piezo1 and Piezo2 mRNA were measured by quantitative polymerase chain reaction from the anterior cruciate ligament (ACL), subchondral bone (Bone), articular cartilage of medial compartment (Cartilage), and L3-4 dorsal root ganglia (DRG). Black and grey bars indicate Piezo expression levels ipsilateral (left) and contralateral (right) to MIA injection, respectively. Light grey and white bars indicate Piezo expression levels ipsilateral (left) and contralateral (right) to saline injection, respectively. Mean ± SEM. NS indicates no significant difference between groups (one-way ANOVA followed by a Bonferroni post hoc test).

