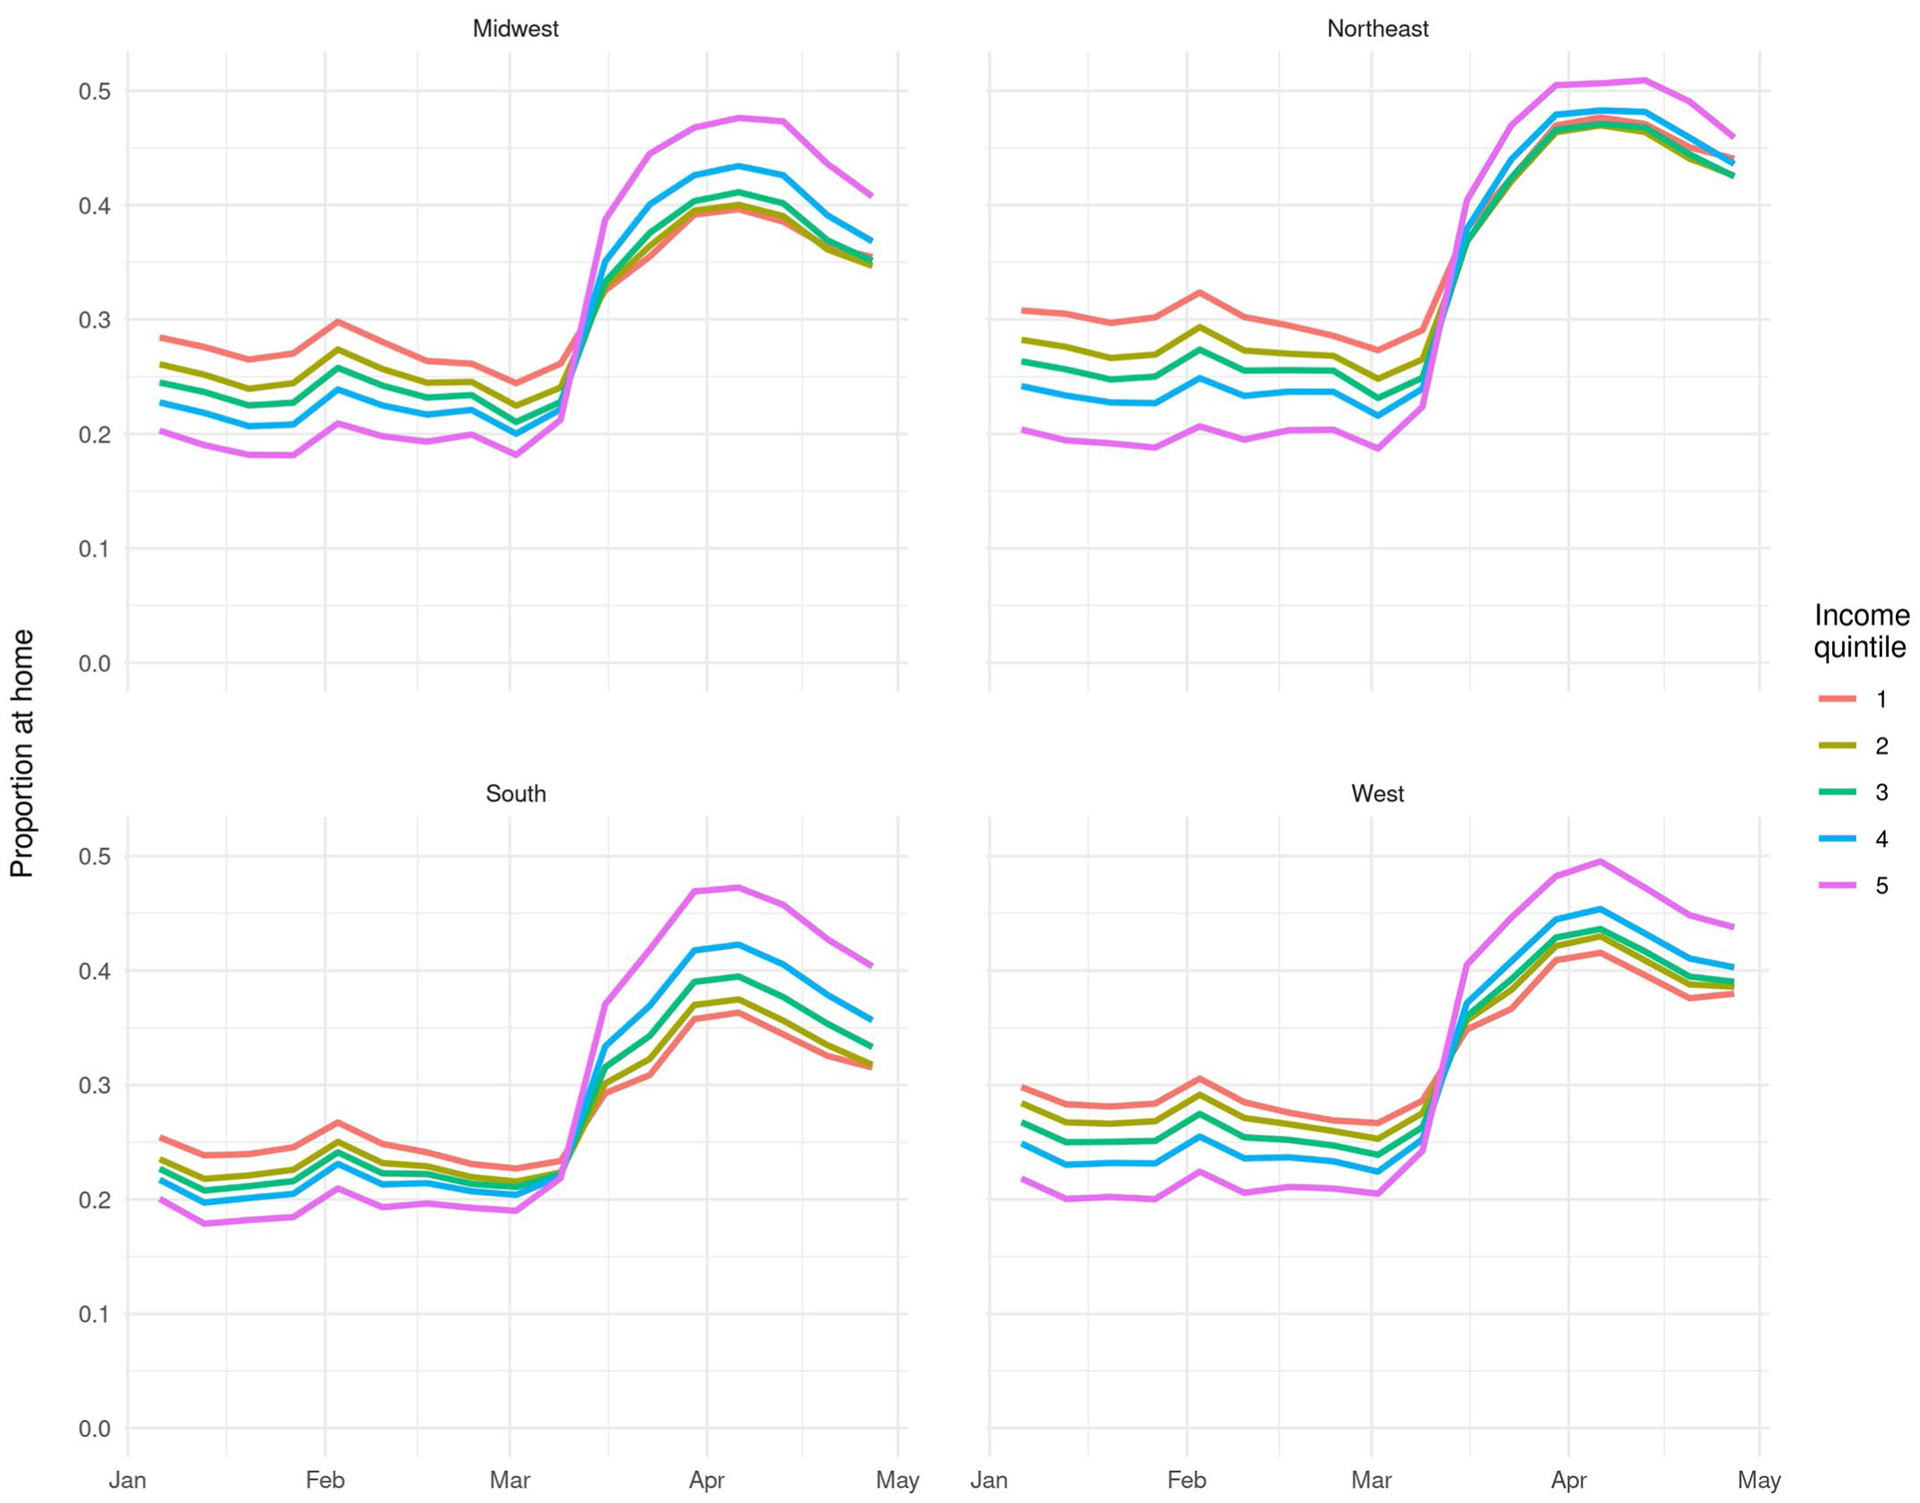
Extended Data Fig. 2 |. Proportion of smartphone users staying home all day by region.

Notes: Income quintile 1 represents the lowest-income group. Outcomes are presented as weekly averages. Period covered is January 6, 2020, through May 3, 2020. Regions are U.S. Census Bureau classifications. Sample comprises 210,288 census block groups with mean 89 active devices per block group per day.
