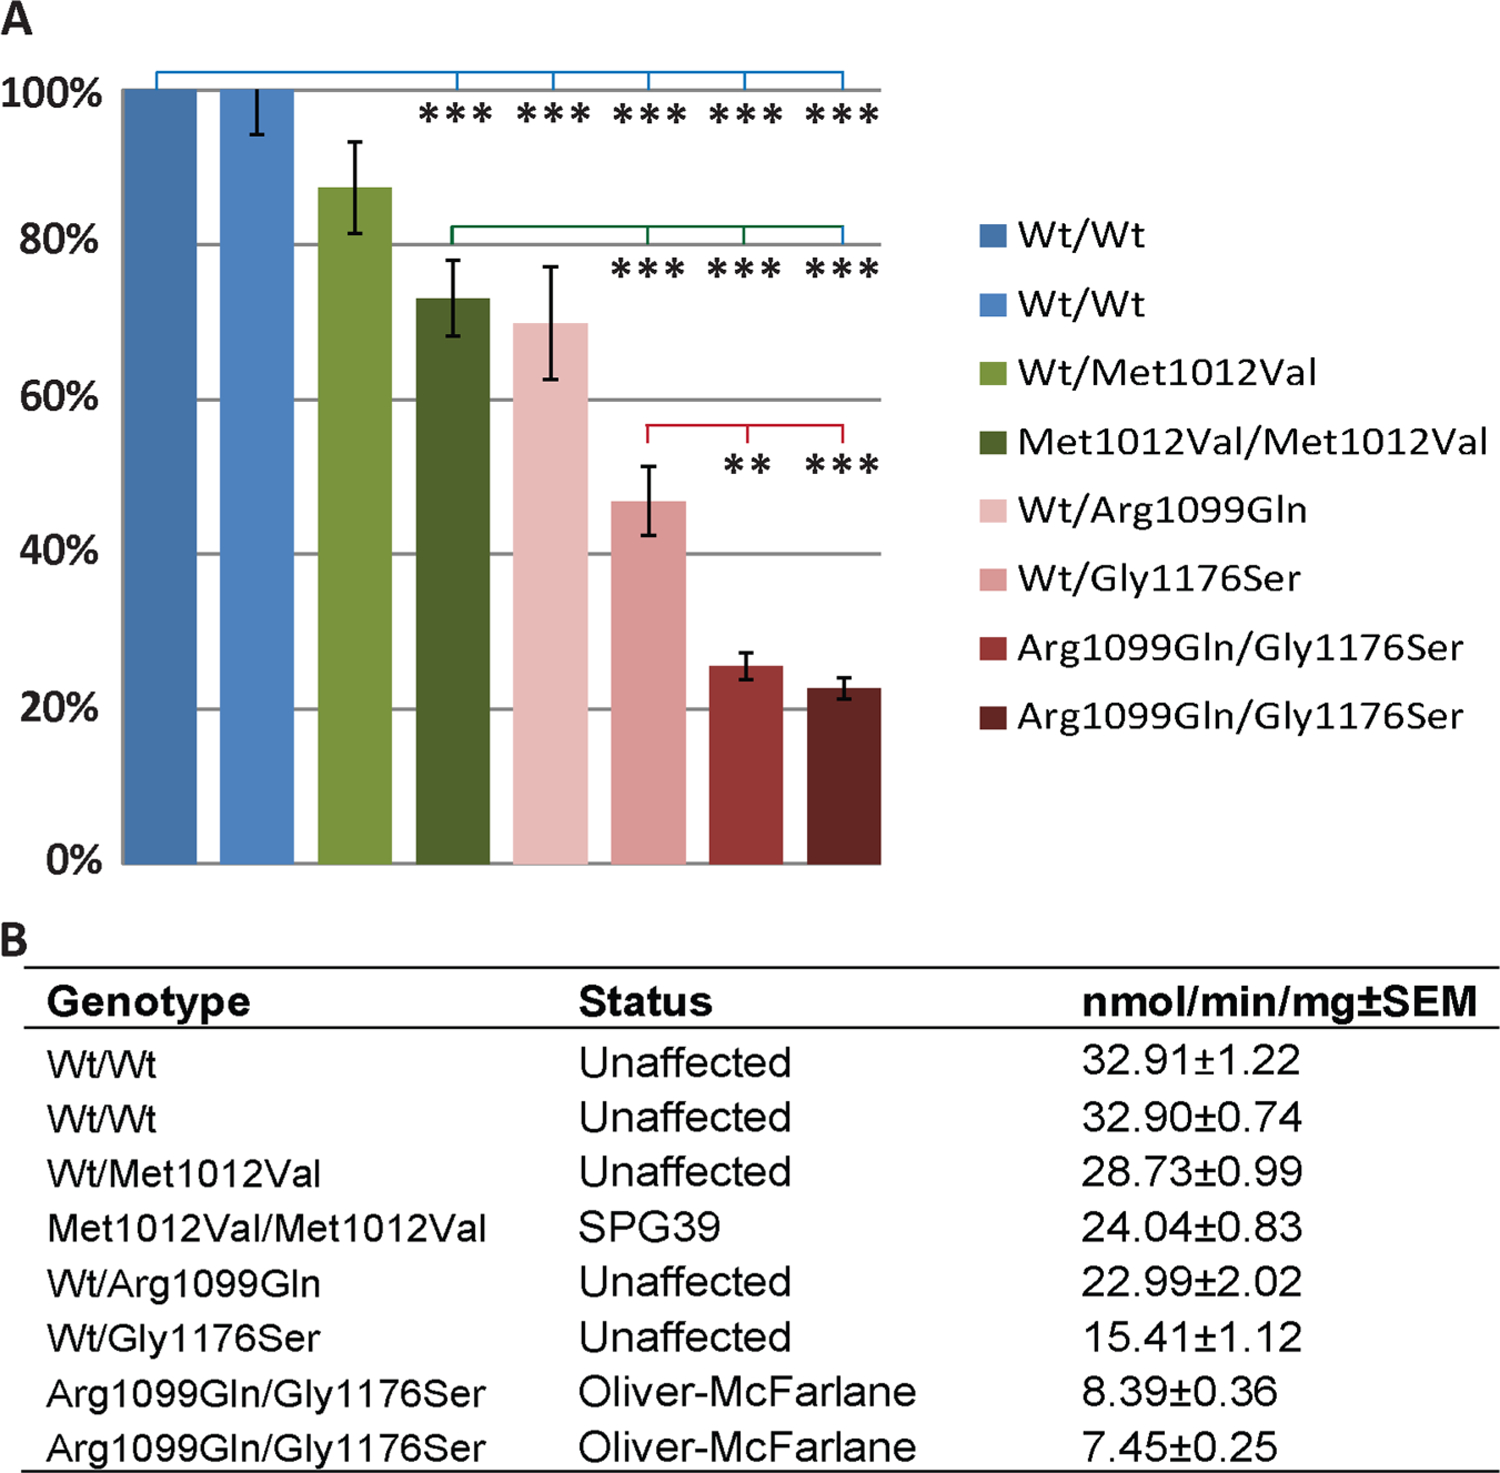
Figure 5.

Differential neuropathy target esterase (NTE) hydrolase activity among PNPLA6-associated diseases. (A) Phenol production normalised to wild-type control cells. Statistical significance of analysis of variance post hoc Tukey’s test comparing wild type (blue line), SPG39 patient cells (green line) or family A carrier cells (red line). (B) Values for phenol production (±SEM) for each cell line along with genotype and affected status. Error bars=SEM; *p<0.05, **p<0.01, ***p<0.001.
