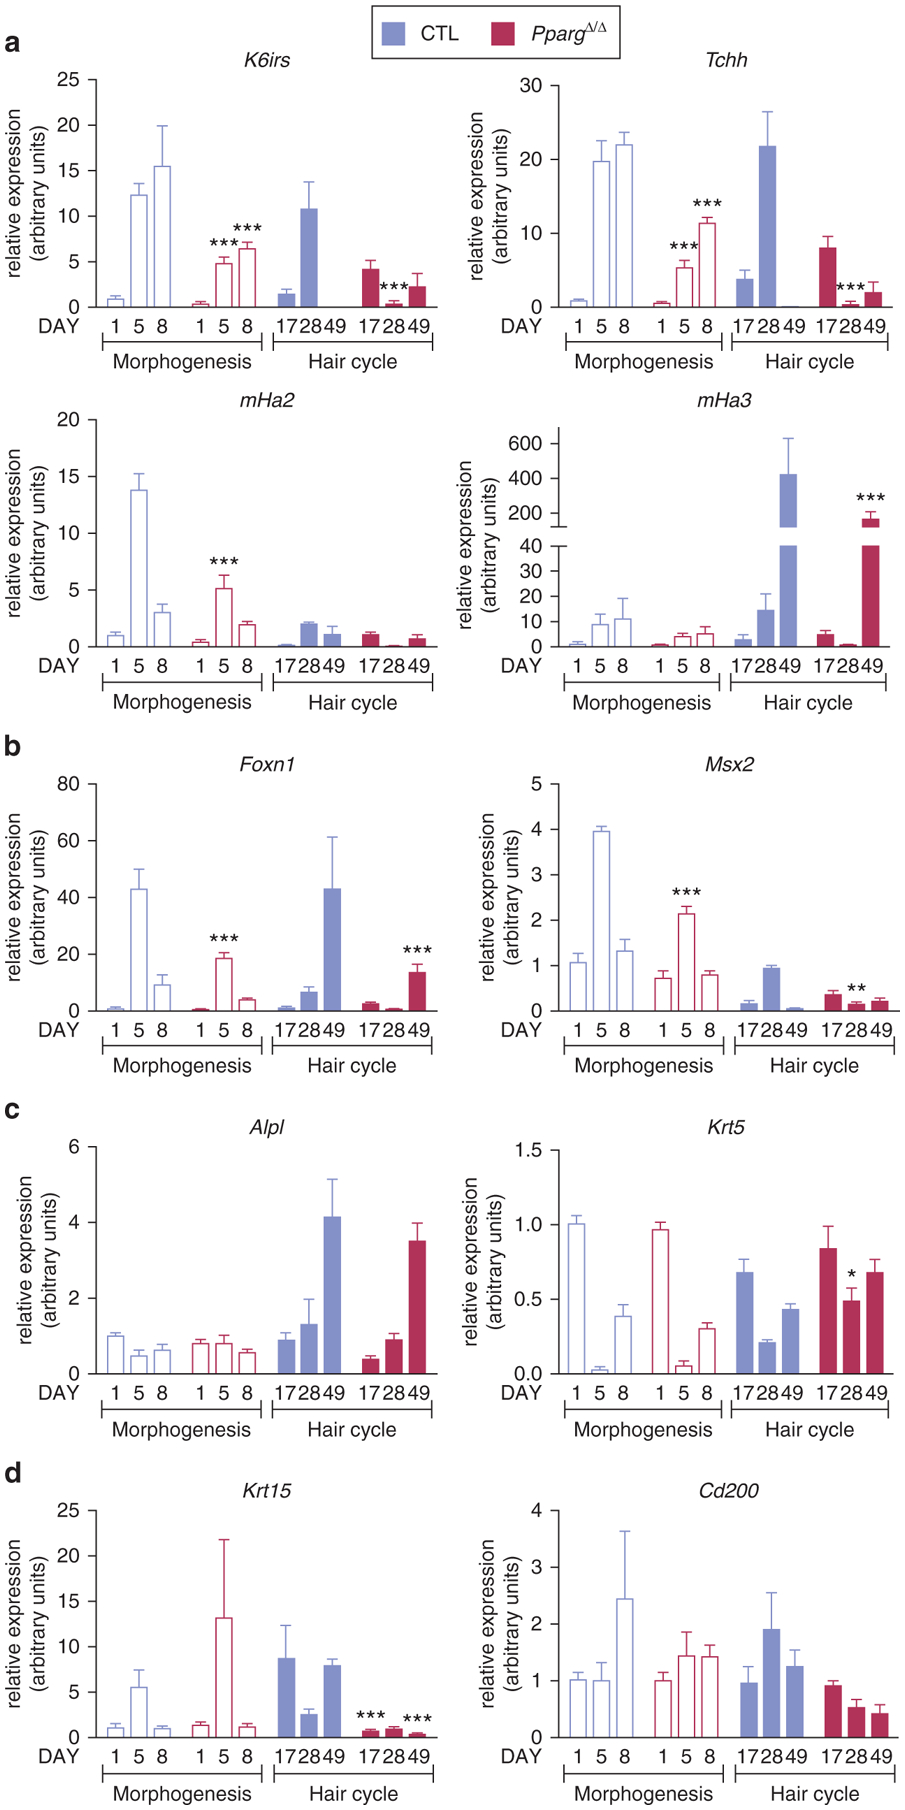
Figure 3. Molecular markers of the hair follicle cell populations are dysregulated in PpargΔ/Δ mice during hair morphogenesis and cycling.

Quantitative PCR analysis of gene expression in skin from Sox2-Cretg/+PpargΔ/emΔ (PpargΔ/Δ) (red bars) and control (CTL) (blue bars) mice. Hair morphogenesis (empty bars): P1 (n = 5), P5 (n = 6), and P8 (n = 5); hair cycle (filled bars): P17, P28, and P49 (n = 4). (a) K6irs, Tchh, and mHa2 and mHa3. (b) Foxn1 and Msx2. (c) Alpl and Krt5. (d) Krt15 and Cd200. Data are normalized to Eef1α1 and expressed as mean ± standard error of the mean. *P < 0.05, **P < 0.01, and ***P < 0.001, with respect to control expression at the same time point. CTL, control; P, postnatal day.
