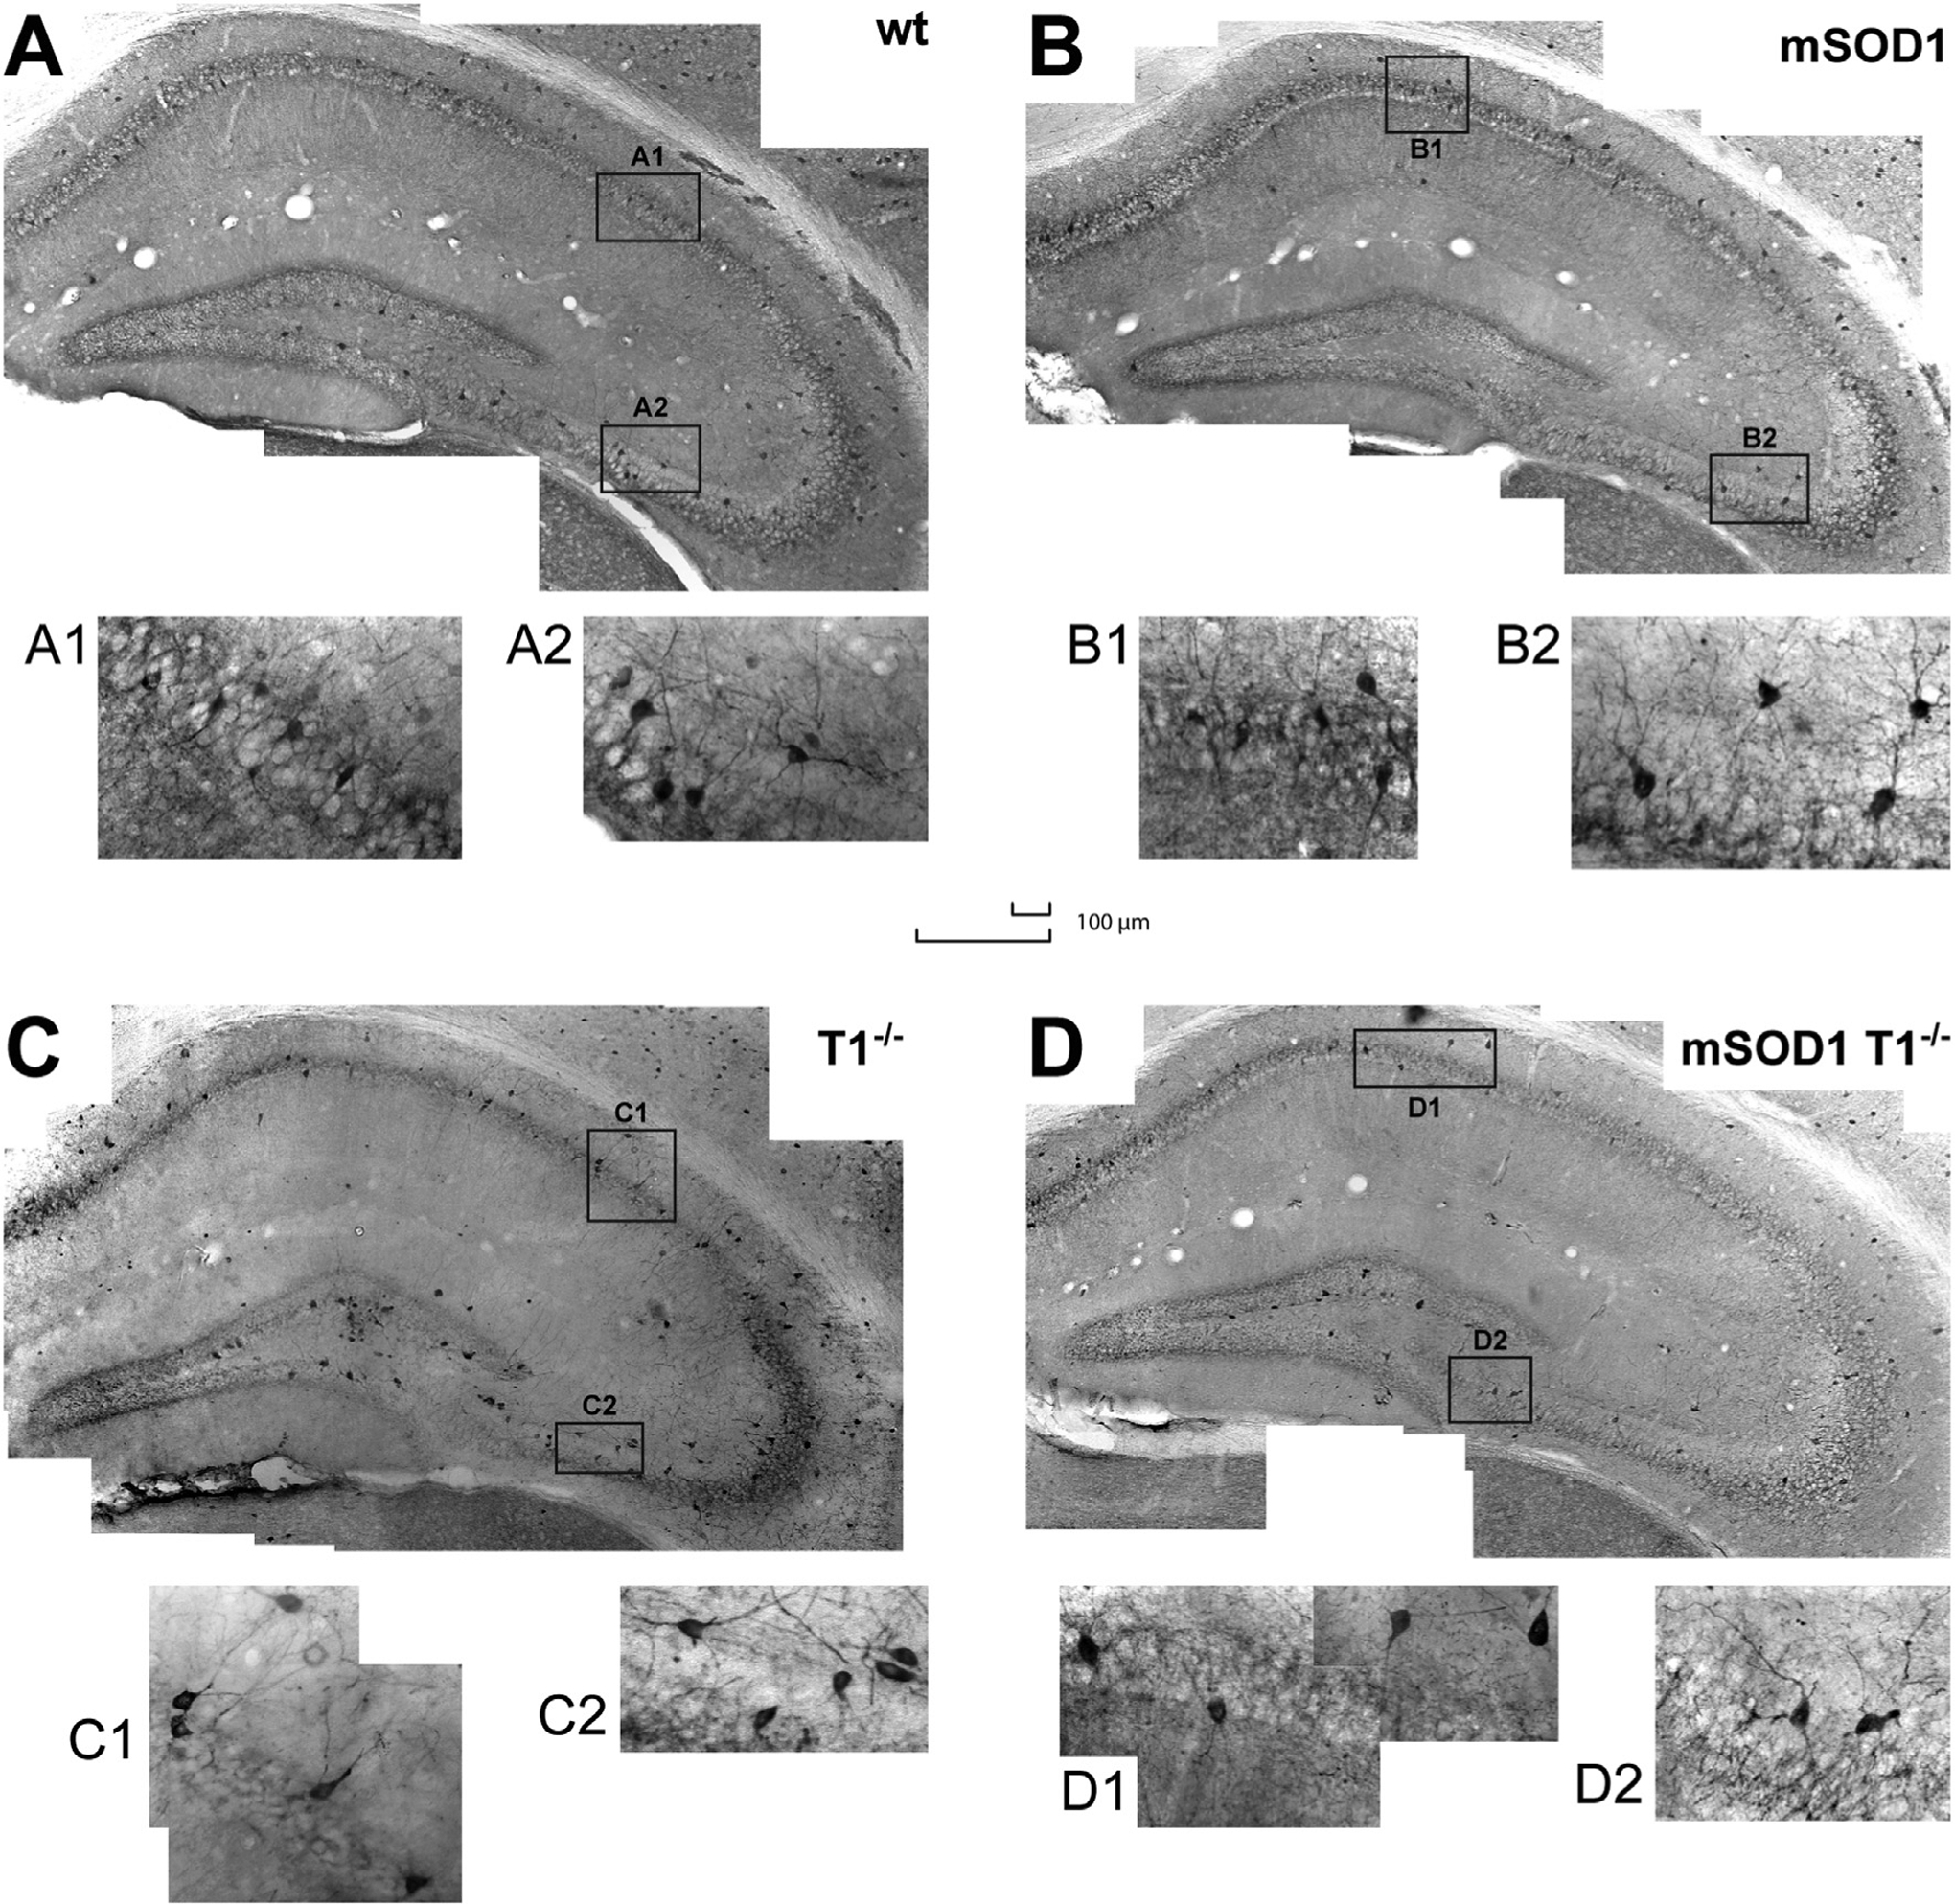
Fig. 2.

The topographic distribution and gross morphology of hippocampal PVi in wt and mSOD1 mice are not influenced by TrkB.T1.
Histological sections of the hippocampus illustrate the topology of PVi (20×) for representative wt (A), mSOD1 (B), T1−/− (C), mSOD1/T1−/− mice (D). Distribution of PVi in the different subfield is preserved across genotypes. Two insets, one for CA1 and one for CA3 (40×), display morphological features of PVi for wt (A1–A2), mSOD1 (B1–B2), T1−/− (C1–C2), mSOD1/T1−/− mice (D1–D2). Note how the neuronal morphology (insets) appears comparable among genotypes. In the CA1–3 subfields, PVi are mostly distributed in the stratum pyramidale, while in the DG they are found mainly in the granular layer. Both scale bars: 100 μm (large scale for insets).
