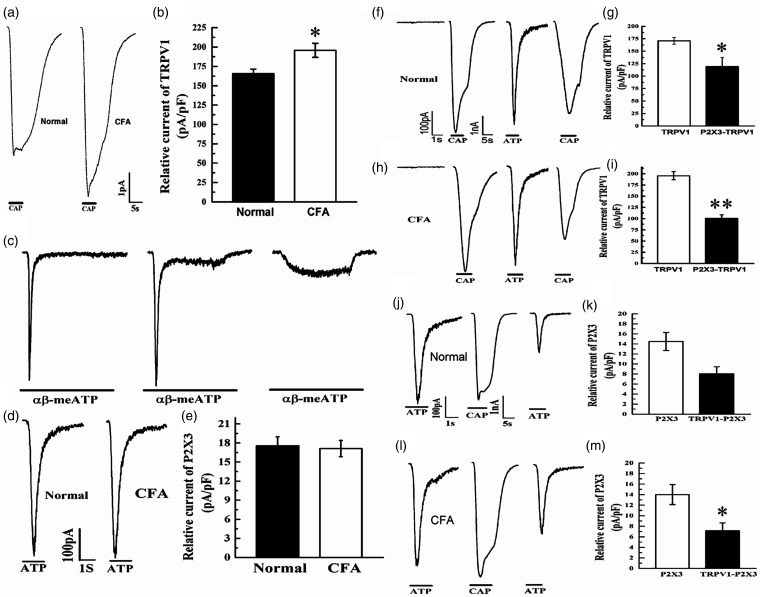
Figure 6.
The correlation effect of TRPV1 and P2X3 of CFA rats in vitro. (a and b) Relative current of TRPV1 in normal group and CFA group. (c) Screening of P2X3 specific DRGs. (d and e) Relative current of P2X3 in normal group and CFA group. (f to i) The effects of P2X3 on TRPV1 in normal group and CFA group. (j to m) The effects of TRPV1 on P2X3 in normal group and CFA group. Compared with Normal group, *P<0.05, **P<0.01.

