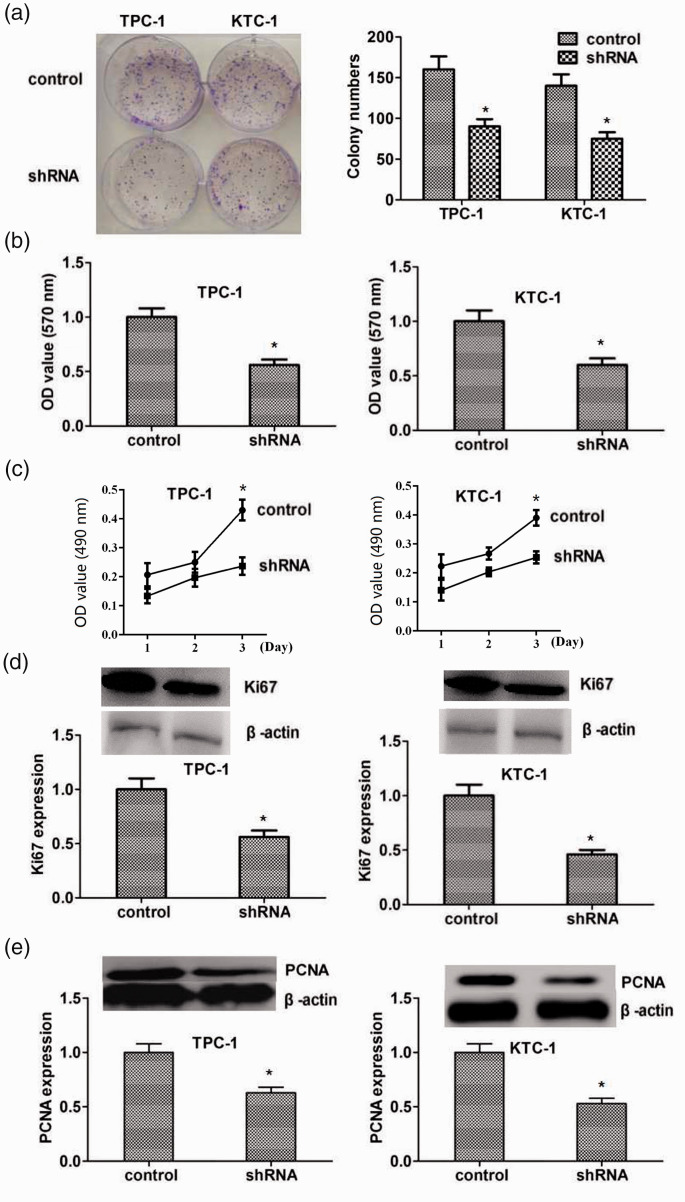
Figure 3.
FKBP5 promoted the proliferation of TPC-1 and KTC-1 thyroid cancer cell lines. (a) TPC-1 and KTC-1 cell growth after FKBP5 depletion was determined by colony-formation assays. (b, c) MTT (b) and CCK-8 (c) assays of TPC-1 and KTC-1 cells after FKBP5 depletion. The optical density was determined after 48 hours. (d) Immunoblot detection of Ki67 protein expression after FKBP5 depletion (upper). Expression levels of β-actin and Ki67 were evaluated using ImageJ with integrated optical density (IOD) based on the results of western blotting. Relative Ki67 expression was normalized to β-actin level. (e) Western blot detection of proliferating cell nuclear antigen (PCNA) protein expression after FKBP5 ablation (upper). Expression levels of β-actin and PCNA were evaluated using ImageJ with IOD based on the results of western blotting. Relative PCNA expression was normalized to β-actin level. *P < 0.05
OD, optical density; shRNA, short hairpin RNA; PCNA, proliferating cell nuclear antigen.

