Figure 1.

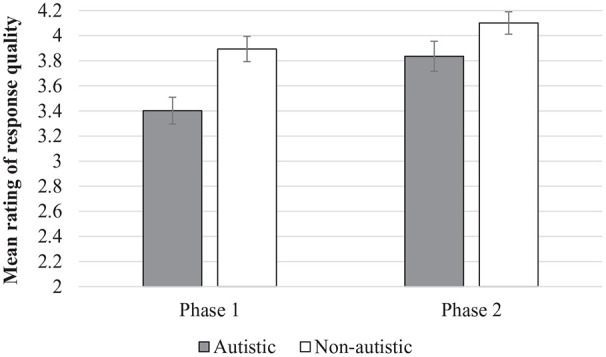
Employers’ mean ratings of autistic and non-autistic interviewees’ responses to questions at Phase 1 and Phase 2 (error bars represent standard errors of the mean).

Employers’ mean ratings of autistic and non-autistic interviewees’ responses to questions at Phase 1 and Phase 2 (error bars represent standard errors of the mean).