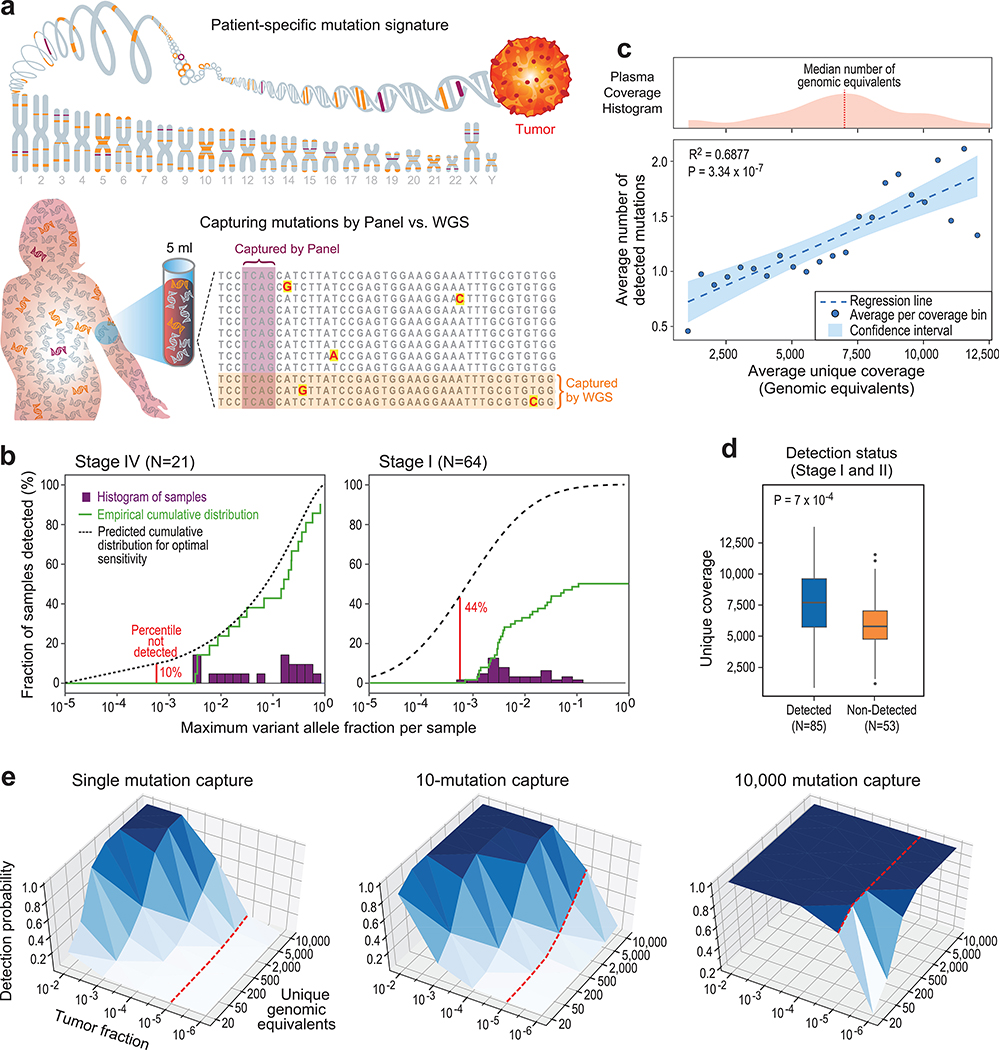
Figure 1: Low cfDNA input material limits sensitive ctDNA mutation detection with deep targeted sequencing, but can be overcome by genome-wide mutational integration.
(a) Illustrative schematic showing that mutations captured by targeted panel deep sequencing are only a small fraction of genome-wide somatic tumor mutations (upper panel). The low input and random sampling nature of cfDNA collection by blood samples results in higher probability for mutation capture by WGS than by targeted panels (lower panel). (b-d) constitute a re-analysis of previously published data18. (b) Histogram of samples detected as a function of the maximum variant allele fraction (VAF) in stage IV (left) and stage I (right) cancer. Maximum VAF serves as an estimation of tumor fraction (TF). Patient histogram (solid bars), empirical cumulative distribution (solid line) and predicted “optimal-sensitivity” detection (dashed line, see Methods) are shown. Lower limit of detection (red solid line) shows a residual of 44% of stage I patients that are not detected by the deep targeted sequencing panel (10% for stage IV). Most of these cancers are predicted to have been detected if the VAF lower-limit-of-detection was 10-5. Re-analysis across 64 stage I and 21 stage IV patient samples across tumor types. (c) Plasma input material (depth of coverage) correlates to the number of detected tumor mutations (correlation and statistical significance calculated with a two-sided Pearson correlation.) Upper panel: distribution (histogram) of unique genomic equivalents (GEs, unique coverage, x-axis) across all patient samples (n = 194 patients, across different tumor types and disease stages) sequenced with exhaustive deep sequencing (median 40,729X). A median of 6,000 (range 400–14,000) unique reads (GEs) was found in a median 4.2mL of plasma (range 1.6–9.8). Lower panel: the average number of mutations detected per patient shows a positive correlation with the number of unique GEs in the patient plasma, indicating that input material is a potential limiting factor for mutation detection with deep targeted sequencing (two-sided Pearson correlation). Dashed line shows regression line, shaded area represents 95% confidence interval. (d) Patient samples with higher number of unique GEs (coverage) have higher probability for cancer detection by deep targeted sequencing (P value = 7*10−4, two-sided Wilcoxon rank-sum test). Analysis includes all detected (n = 85) and non-detected (n = 53) stage I/II patients across tumor types. Boxplots represent median, bottom and upper quartile; whiskers correspond to 1.5 x IQR. (e) Predicted probability (analytic derivation from binomial distribution of Bernoulli trials, see Methods) of detecting at least one mutated (SNV supporting) read as a function of the number of unique GEs (coverage) and the fraction of ctDNA in cfDNA (tumor fraction, TF). Left: targeting only a single SNV (e.g., with digital droplet PCR), the probability for detection decreases rapidly with tumor fraction (e.g., probability to detect at 10−5 with 5000 GEs is <0.05, red line). Middle: targeting 10 patient-specific mutations (e.g., 1Mbp panel for patient with 10/Mbp mutation load or a typical exome-based patient specific panel17) shows low probability of detection in low TF (e.g., probability to detect at 10−5 with 5000 GE is <0.4 , red line). Right: targeting 10,000 patient-specific mutations (e.g., whole genome sequencing for patient with >4/Mbp mutation load) shows significant probability of detection in low tumor fraction even with modest coverage (e.g., probability to detect at 10−5 is > 0.99 with 50X coverage, red line).

