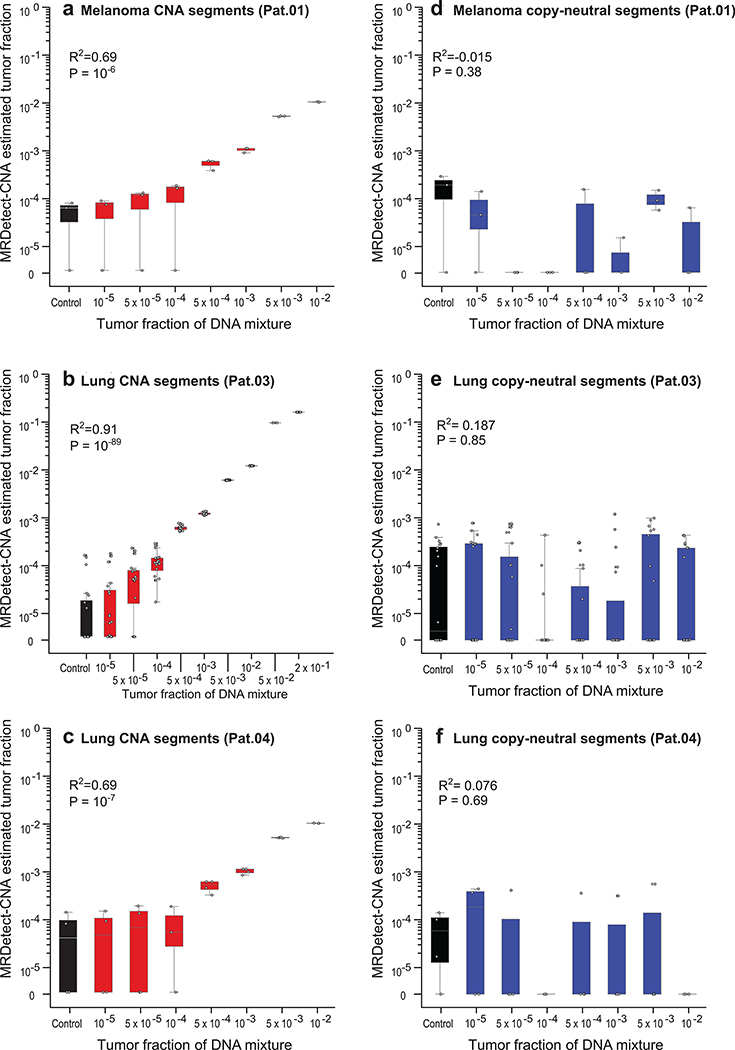
Extended Data Fig. 5. CNA based detection of ctDNA tumor fraction.
(a-c) Tumor fraction (TF) inference using MRDetect genome-wide CNA integration for representative patients, including melanoma (a: Pat.01) and lung cancer (b: Pat.03, c: Pat.04). Each plot was generated using in silico admixtures of varying TF (range 10−5 – 0.2) in 18X coverage, by randomly downsampling and mixing tumor reads (mean coverage 97X, range 85X-110X) and germline reads (mean coverage 49X, range 43X-56X) from WGS data (see Methods; Supplementary Table 1). Twenty replicates used for each TF > 0 sample, and for the control (TF = 0) samples, showing accurate TF estimation as low as 5*10−5, discriminated from control (TF = 0) samples (left box-plot), with high Pearson correlation between the input TF mixture (x-axis) and the CNA-based estimated TF prediction (two-sided test). (d-f) Tumor fraction (TF) inference in neutral regions (no copy number gain or loss in the tumor WGS data) for the same in silico admixtures (d: melanoma, Pat.01; e: lung, Pat.03; f: lung, Pat.04), shows the expected low Pearson correlation between input admixture TF and the signal (two-sided test), consistent with no expected coverage changes in the plasma admixtures in these regions. Throughout the figure, boxplots represent median, bottom and upper quartile; whiskers correspond to 1.5 x IQR.

