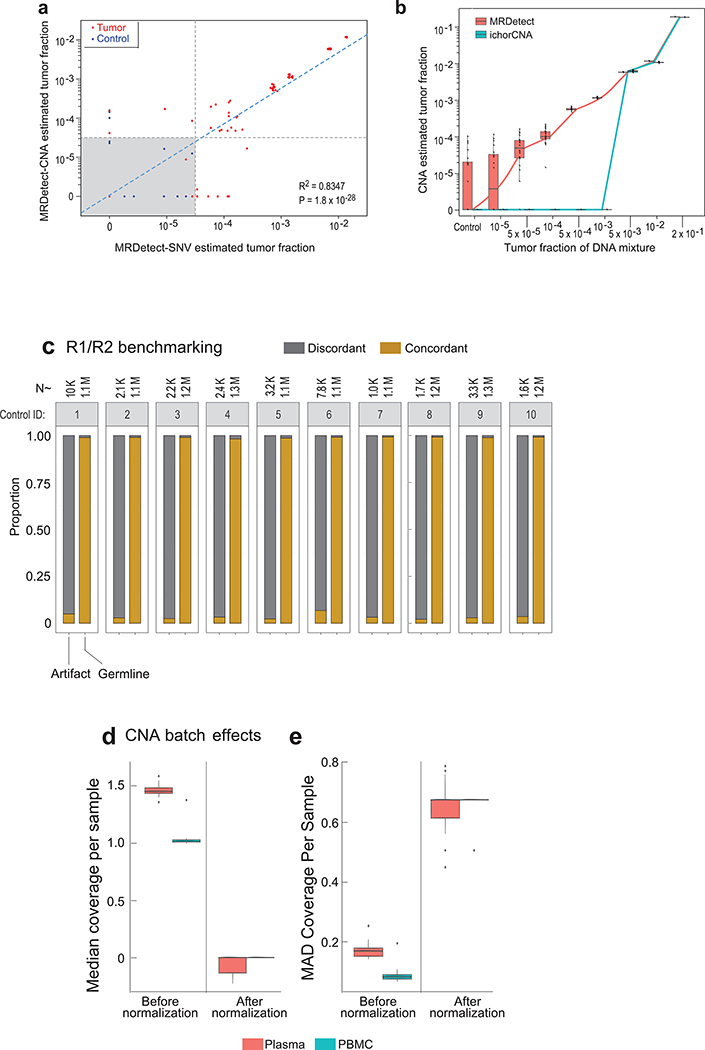
Extended Data Fig. 6. CNA and SNV MRDetect correlation and further error suppression.
(a) Spearman correlation between SNV and CNA TF estimation across TF admixtures for a lung tumor (Pat.03) shows high correlation (two-sided test) between the two orthogonal inference methods. Red dots correspond to cancer plasma (TF > 0) samples and blue dots correspond to control plasma (TF = 0) samples. Detection threshold (dashed lines) were set on TF < 5*10−5 for both methods. Eleven replicates used for each TF > 0 sample, and 20 replicates were used for the control (TF = 0) samples. (b) Comparison to an orthogonal CNA-based TF method- ichor-CNA15. Analyzing the same cohort of breast cancer (Pat.05) in silico synthetic admixture samples shows concordance in TF estimation for high TF (TF > 5*10−3), with extension of detection for MRDetect to lower TFs. The same 20 replicates were used for both MRDetect and ichor-CNA for each of the TF > 0 and control (TF = 0) samples. (c) Proportion of variant concordant (brown) vs. discordant (gray) read pairs (R1 and R2) detected in germline SNPs and artifactual variants. Analysis was done across 10 control (benign lung lesions) plasma samples, comparing read-pairs associated with germline SNPs (right bar) vs. read-pairs associated with artifactual variants (left bar) per plasma sample. The artifactual variants were defined by read pairs with variants overlapping the union of all patient somatic SNVs compendia across all LUAD patients, that were observed with the same variant in the control plasma sample. The number of read-pairs used in the analysis is indicated above each bar. (d) Median genome-wide normalize (divided by mean coverage) coverage from matched germline PBMC WGS samples from patients with LUAD (cyan, n = 15) and control plasma WGS samples from patients with benign lung lesions (red, n = 11) before and after robust Z-score normalization. (e) Median absolute deviation (MAD) calculated over normalized-coverage (i.e., divided by mean coverage) from matched germline PBMC and control plasma WGS samples as in (d) before and after robust Z-score normalization. Throughout the figure, boxplots represent median, bottom and upper quartile; whiskers correspond to 1.5 x IQR.

