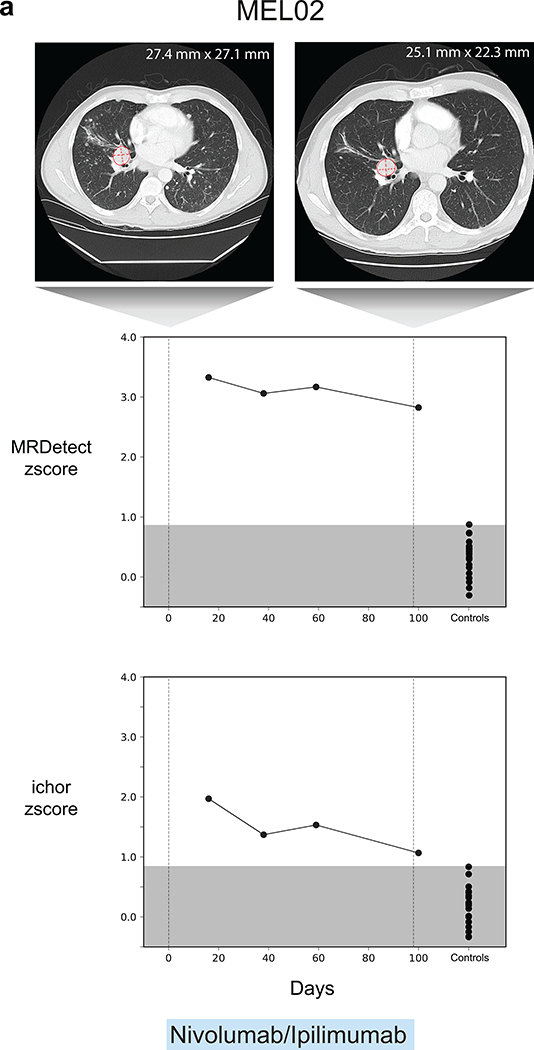
Extended Data Fig. 7. Serial application of MRDetect to monitor melanoma response to immunotherapy.
Melanoma treatment response (Patient MEL02) during immunotherapy (Nivolumab) is monitored by blood samples. Upper panels- Treatment monitoring by computed tomography (CT) shows response to therapy but residual disease after 3 months of therapy. Middle panel- MRDetect Z-scores effectively track tumor responses, matching radiographic changes, in higher temporal resolution than that feasible with imaging. Lower panel- ichor-CNA captures treatment response dynamics but showing lower signal to noise ratio compared to the MRDetect method. For both MRDetect and ichor-CNA methods, Z-score is calculated from a single plasma sample for each timepoint compared to a panel of control samples (n = 30). Throughout the figure, boxplots represent median, bottom and upper quartile; whiskers correspond to 1.5 x IQR.

