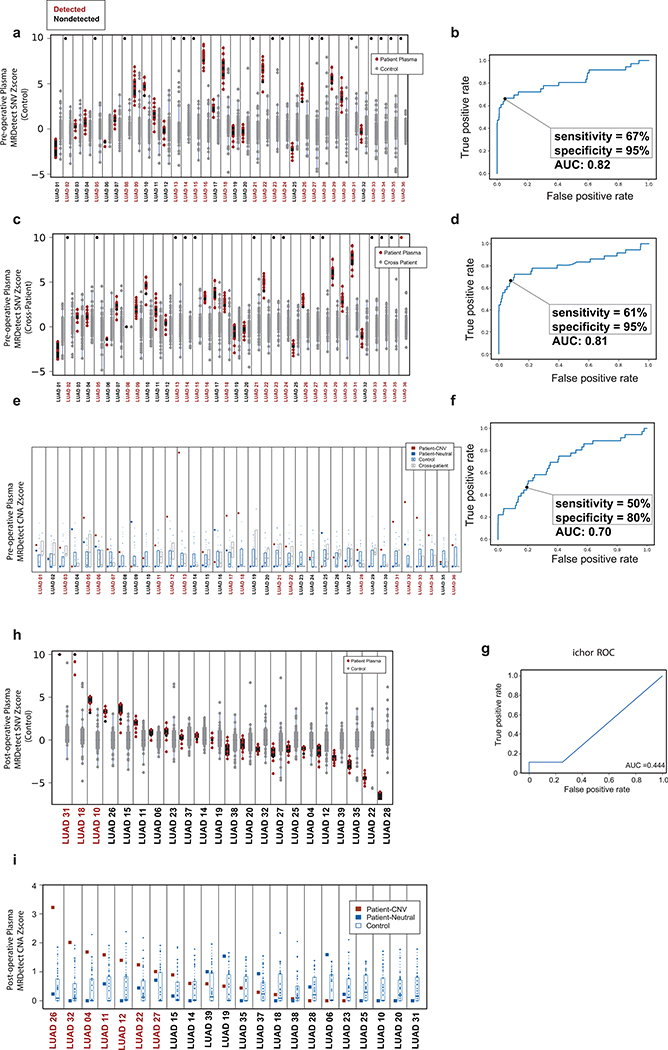
Extended Data Fig. 9. MRDetect performance in LUAD monitoring.
(a) Robust Z-score discrimination between signal detected across 20 random subsamplings (80% of reads per subsampling iteration) of LUAD patient pre-operative plasma (black, n = 36 patients) and the cohort of control plasma test set (gray, n = 30). The signal was measured on the subsampling set and control test set using the same patient-specific point mutation (SNV) compendium. Z-score was calculated using the noise parameters estimated in the control test cohort (see Methods). (b) Receiver-operating-curve (ROC) analysis was performed over all SNV-based Z-score values calculated on the patients’ pre-operative plasma and control plasma as in (a). (c) Cross patient noise evaluation. Robust Z-score discrimination between signal detected at 20 random subsamplings (80% of reads per subsampling iteration) of LUAD patient pre-operative plasma WGS (black, n = 36 patients), cross-patient noise estimation via application of the patient-specific compendium to all other patient pre-operative plasma (n = 35, gray). Z-score was calculated using the noise parameters estimated in the cross-patient cohort (see Methods). (d) Receiver-operating-curve (ROC) analysis was performed over all SNV-based Z-score values calculated on the matched patients and cross-patient plasma. (e) Z-score discrimination between MRDetect-CNA on LUAD patient pre-operative plasma (red, n = 36 patients) compared to signal detected in neutral regions (as a negative control, blue), control plasma test cohort (n = 30) and cross-patient cohort (n = 35). Cross-patient noise was estimated by applying the patient-specific CNA compendium to other patient plasma samples (n = 35, all other patients). Z-score was calculated using the noise parameters estimated by the control plasma cohort. (f) Receiver-operating-curve (ROC) analysis was performed over all CNA-based Z-score values calculated on the patients’ pre-operative plasma and control patients. (g) ROC analysis was performed over all ichor-CNA4 TF values calculated on the LUAD patients’ pre-operative plasma and control patients (n = 66). Interestingly the two patient plasma samples detected by ichor-CNA included events that do not appear in the tumor, one of them was found to be a PBMC specific somatic event (potentially from clonal hematopoiesis). Throughout the figure, boxplots represent median, bottom and upper quartile; whiskers correspond to 1.5 x IQR. (h) Z-score discrimination between signal detected in 20 random subsampling (80% of reads per subsampling iteration) of LUAD patient plasma WGS (n = 22 patients) collected at a median of 17 days after surgery and a cohort of control plasma test samples (gray, n = 30). The signal was measured on the matched plasma and control set using the same patient-specific point mutation (SNV) compendium. Z-score was calculated using the noise parameters estimated in the control cohort (see Methods). (i) Z-score discrimination between MRDetect-CNA on LUAD patient plasma (red, n = 22 patients) collected at a median of 17 days after surgery, compared to signal detected in neutral regions (as a negative control, blue) and control plasma cohort (n = 30). Z-score was calculated using the noise parameters estimated by the control plasma cohort (see Methods). Throughout the figure, boxplots represent median, bottom and upper quartile; whiskers correspond to 1.5 x IQR.

