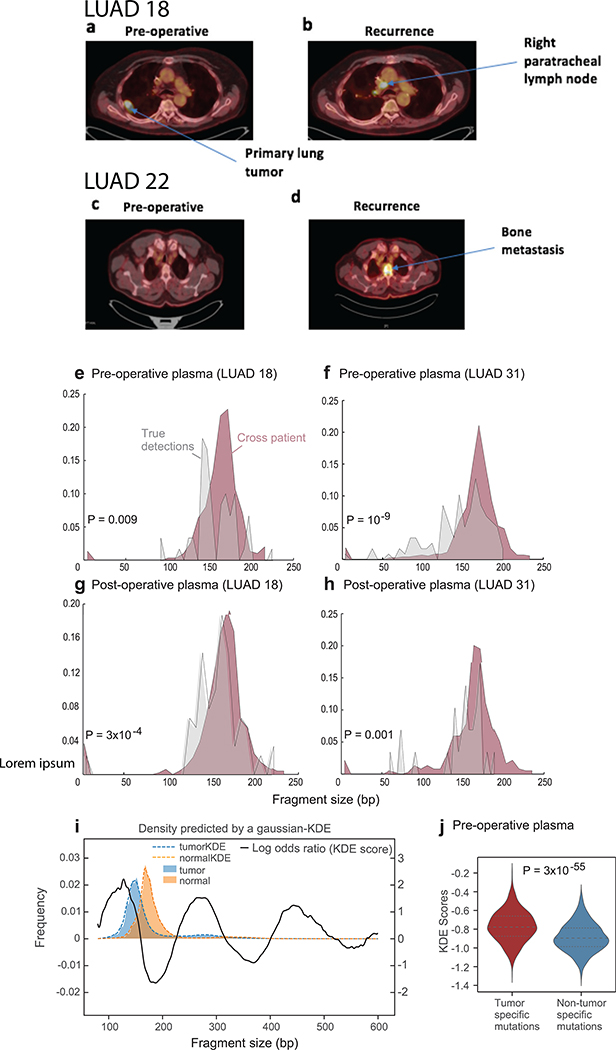
Extended Data Fig. 10. Imaging of sample monitored LUAD cases and fragment length analysis.
Positron emission tomography–computed tomography (PET-CT) of two patients (LUAD#3 and LUAD#6) confirms no radiographically observable metastatic spread at the time of surgery (a and c, respectively), while metastatic recurrence has been identified approximately six months post-operative by PET-CT (b and d, respectively). (e-h) Representative fragment size histograms showing the distribution of DNA fragments as a function of the fragment length. DNA fragments that are associated with tumor mutations (gray) are showing significantly shorter size compared to DNA fragments that are associated with artifactual non patient-specific detections (red, derived from applying cross-patient mutational compendia; median P value < 10−3, two-sample t-test). Plots include two pre-operative plasma samples (e: LUAD#18, tumor mutation detection n = 35, artefactual detection n = 18802 ; f: LUAD#31, tumor mutation detection n=82, artefactual detection n = 32530) and matching plasma samples after surgery (g: LUAD#18, tumor mutation detection n = 55, artefactual detection n = 22737; h: LUAD#31, tumor mutation detection n = 27, artefactual detection n = 14610). (i) Kernel-density-estimator (KDE) trained to discriminate between tumor-derived (human aligned reads from a patient derived xenograft model, see Methods, blue) and normal-derived (from control plasma samples, orange) cfDNA based on the fragment size signature. The log difference between the tumor and normal density functions (black solid line) was used as a score function that integrates the fragment size shift signal across the entire fragment sizes distribution (80bp-600bp). (j) Pre-operative cfDNA showed significant shift (two-sample t-test) in their tumor-specific mutation detections in the patient plasma (red, n=563), compared to non-tumor (cross-patient) detected mutations in the same samples (blue, n=4184). Violin plots depict kernel density estimates of the density distribution. Center dashed lines represent the median and dashed lines represent the interquartile range.

