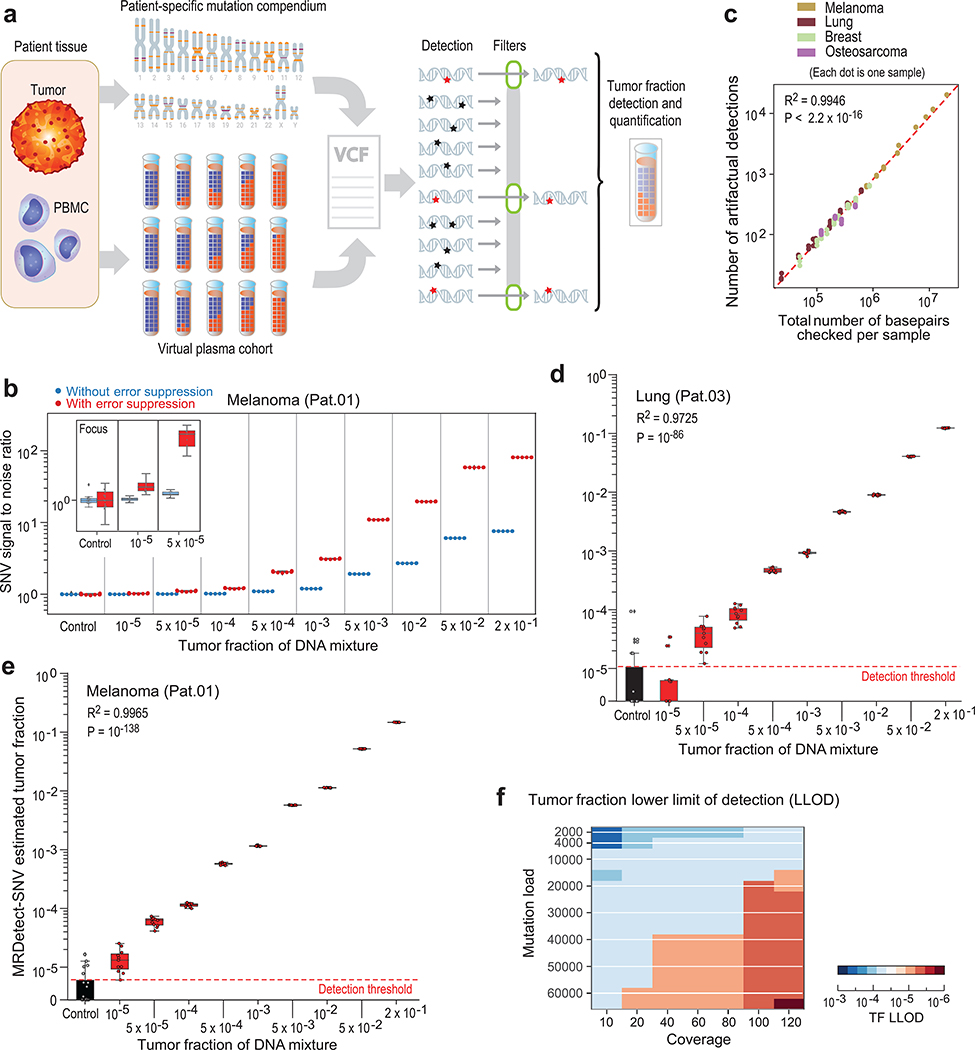
Figure 2: Patient-specific genome-wide SNV integration provides ultra-sensitive ctDNA detection and precision tumor fraction (TF) estimation.
(a) Illustration of genome wide SNV integration for inference of plasma TF, and analytical validation scheme. Patient-specific SNV mutations are detected from matched tumor and peripheral blood mononuclear cells (PBMC) germline whole genome sequencing (WGS). Tumor somatic SNVs are then used to calculate the genome-wide tumor signal in the patient’s plasma sample. To test this approach, for each cancer, tumor and PBMC WGS reads were mixed to generate a range of TFs (10−5-0.2) in 35X coverage with multiple replicates (n = 11, see Methods). Across eight patient samples with four different tumor types (lung, melanoma, breast and osteosarcoma), we generated over 700 in silico admixture samples. Detection and filtering were applied on each patient sample to benchmark the tumor fraction detection sensitivity and accuracy. (b) Patient-specific SNV signal-to-noise quantification over a range of TFs (10−5-0.2) compared to basal noise signal detected in control (TF = 0) samples (left column), estimated using melanoma sample (Pat.01). Signal-to-noise was estimated by calculating the log difference between the number of detections in each plasma sample (TF > 0) and the mean number of detections in the controls (TF = 0). Inset panel shows discrimination of tumor and control samples down to tumor fraction 10−5 after utilizing machine-learning-based sequencing error suppression (red) vs. reduced sensitivity with the raw unfiltered data (blue). For TFs > 0, n = 11 independent admixture samples. For the control (TF = 0), n = 20 independently down-sampled PBMC replicates. (c) Correlation between the number of base-pairs evaluated for SNVs and the number of mismatches detected (artefactual detections), measured over all synthetic control plasma (no tumor DNA, TF = 0, n = 341) from eight patients and mutational compendia from four tumor types (lung, breast, melanoma and osteosarcoma). Results show a constant error rate, independent of tumor type, corresponding to previously published21,40 Illumina sequencing error-rate estimates (~1/1000 bps) (correlation and statistical significance calculated with a two-sided Pearson correlation). (d-e) Tumor fraction (TF) inference using genome-wide SNV integration for lung cancer (Pat.03) (d) and melanoma (Pat.01) (e) samples, shows accurate TF estimation as low as 5*10−5 and 10−5, respectively, discriminated from control (TF = 0) samples (left box-plot). High Pearson correlation (two-sided test) between the input TF mixture (x-axis) and the SNV-based estimated TF prediction, confirms accurate inference based on genome-wide mutational integration. For TFs > 0, n = 11 independent admixture samples. For the control (TF = 0), n = 20 independently down-sampled PBMC replicates. (f) The lower-limit-of-detection (LLOD) was empirically measured as a function of the input mutational load and the WGS coverage showing that for high mutational loads (~60,000 mutations) achieving sensitivity nearing 10−6 is feasible. Analysis was done over 21,420 in silico admixtures, varying TF (10−3-10−6), coverage (10–120X), mutation load (2,000–63,000), and across 20 replicates (random read downsampling) for each admixture. Lower-limit-of-detection (LLOD) was defined by the lowest tumor fraction that show significant Z-score separation from the control (TF = 0) cohort, for the same context (mutation load and coverage depth, see Methods). Throughout the figure, boxplots represent median, bottom and upper quartile; whiskers correspond to 1.5 x IQR.

