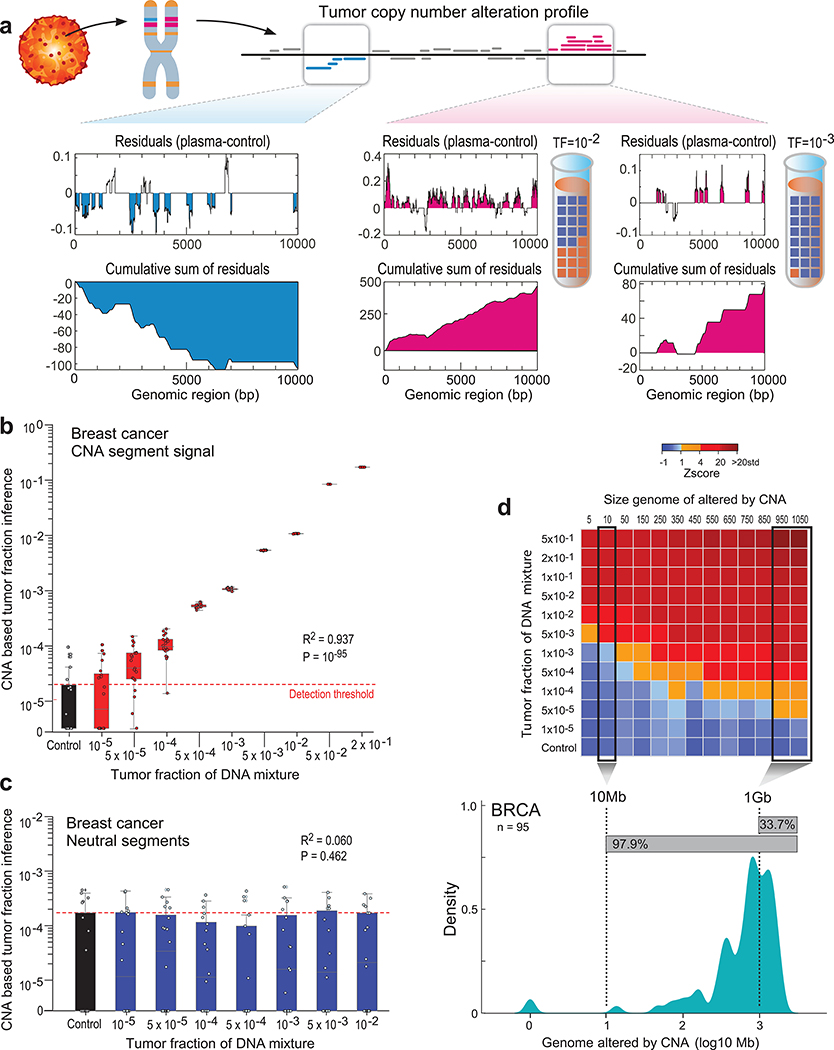
Figure 3: Patient-specific genome-wide CNA integration provides ultra-sensitive ctDNA detection and precision tumor fraction (TF) estimation.
(a) Illustration of the genome-wide copy number alteration (CNA) integration for the inference of plasma tumor fraction (TF). Patient-specific CNA segments are detected from matched tumor and germline WGS. Tumor CNA segments are then used to calculate the genome-wide accumulated signal in the patient’s plasma sample. Amplification segments (right panels, pink) in synthetic plasma with TF of 1% and 0.1% show sparse TF correlated signal that can be integrated due to the positive read coverage bias. Deletion segments (left panel, blue) show similar sparse signal, which is negatively biased. Upper panel: normalized coverage difference between plasma and control (TF = 0) across a 10Kbp region. Lower panel: sum of coverage differences between plasma and control. (b) Utilizing patient-specific CNA mixture model allows for the integrated CNA signal to be directly converted to TF estimates in a breast cancer (Pat.05) in silico synthetic plasma sample, with accurate TF estimation as low as 5*10−5, discriminated from the control samples (TF = 0, left box-plot). High Pearson correlation (two-sided test) between the input TF mixture (x-axis) and the CNA-based estimated TF (y-axis) shows accurate inference based on CNA patterns. N = 20 for each TF > 0 sample, as well as the control (TF = 0) samples. (c) Utilizing the CNA mixture model on copy-neutral regions of the same tumor genome (i.e., regions that do not show differential read-coverage between tumor and germline WGS), do not show correlation with TF (two-sided Pearson correlation). N = 20 for each TF > 0 sample, as well as the control (TF = 0) samples. (d) CNA method lower-limit-of-detection (LLOD) was empirically measured as a function of the CNA load showing high sensitivity (5X10⁻⁵) for tumors with copy number variation footprint of 1Gb or more.Upper panel: ctDNA detection at various TF (10−5 - 5*10−1 and control (TF=0)) and CNA load (5Mb - 1050Mb) estimated in a breast cancer (Pat.05) in silico synthetic plasma samples. Detection is observed at TF=5*10−3 at 5Mb and as low as TF=5*10−5 at 1Gb (Z score >= 1). Lower panel: Smoothed histogram (kernel density estimate) of a representative cohort of WGS breast cancer (BRCA) samples from TCGA (n = 95). Majority (97.9%) of the samples have CNA load above 10Mb and 33.7% have CNA load above 1Gb, corresponding with ultra-high ctDNA sensitivity. CNA method lower-limit-of-detection (LLOD) was empirically measured as a function of the CNA load showing high sensitivity (5X10⁻⁵) for tumors with copy number variation footprint of 1Gb or more. Upper panel: ctDNA detection at various TF (10−5 - 5*10−1 and control (TF=0); 20 random admixtures each) and CNA load (5Mb - 1050Mb; 3 random subsampling each) estimated in a breast cancer (Pat.05) in silico synthetic plasma samples. Throughout the figure, boxplots represent median, bottom and upper quartile; whiskers correspond to 1.5 x IQR.

