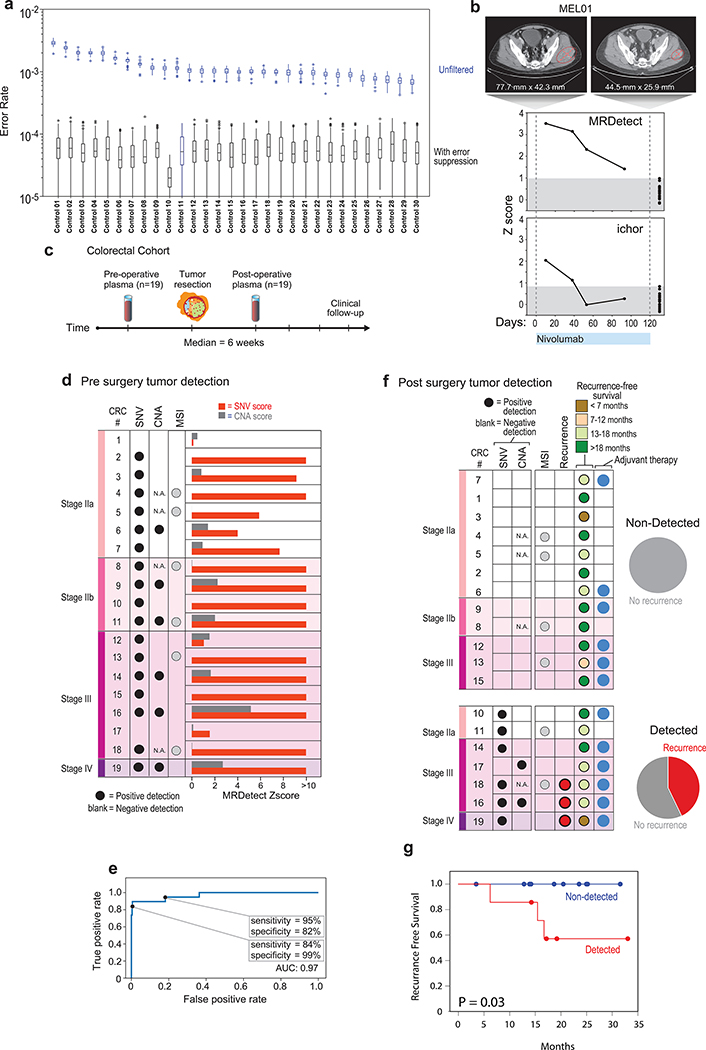
Figure 4: Detection of ctDNA using MRDetect in Melanoma during immunotherapy and colon cancer post-operatively.
(a) Error rate estimation in a cohort the test control plasma samples (n = 30) with and without error suppression. Applying support vector machine (SVM) error suppression and paired-end read concordance allow sequencing error reduction by a median 21 fold and increase the uniformity between samples (2-fold decrease in coefficient of variation). Boxplots represent median, bottom and upper quartile; whiskers correspond to 1.5 x IQR. (b) Melanoma treatment response during immunotherapy (Nivolumab) is monitored by blood samples. Treatment monitoring by computed tomography (CT) shows response to therapy but residual disease after 3 months of therapy (upper panel). MRDetect Z-scores effectively track tumor responses, matching radiographic changes, in higher temporal resolution than that feasible with imaging (middle panel). Ichor-CNA sensitivity captures initial treatment response dynamics but does not detect residual disease after 3 months of treatment. Z-score is calculated from a single plasma sample for each timepoint compared to a panel of control samples (n = 30). (c) Illustration of the colon cancer clinical cohort and potential clinical utility for liquid biopsy residual disease detection post-operatively. Upon surgical resection of tumor, the primary tumor is sequenced to define the tumor mutational compendium. Pre-operative plasma is used to verify tumor mutational integration detection in cfDNA and establish detection performance metrics. Post-operative plasma (median 6 weeks) is used to establish the presence of residual disease. (d) Colorectal cancer (CRC) detection on pre-operative plasma samples (n = 19 patients), using SNV (red) and CNA (gray) MRDetect methods. Z-score estimation (bar plots) was used to calculate mutation signature detection in the patient plasma in comparison to detection in the control plasma test cohort (n = 30). Z-score (> 4 and >1.3) was used for the SNV or CNA methods, respectively, to define a positive tumor detection based on ROC optimization on each method (e) Receiver operating curve (ROC) analysis on a combined detection model of SNV and CNA mutational compendia. Pre-operative plasma samples (n = 19) were used as the positive label, and the panel of control plasma samples against all patient mutational compendia (n = 570, nineteen mutational compendia assessed across thirty control samples) was used as the negative label. Two operational points (Z-score thresholds) are shown that correspond with two different specificity regimes. (f) Detection of ctDNA post-operative (6 weeks after surgery) in plasma samples (n = 19) was performed using Z-score estimation in comparison to the cohort of control plasma samples (n = 30). Patients with clinical recurrence, are indicated by red dots. Post-operative ctDNA detection (lower panel) is associated with early disease recurrence as shown in the pie chart. None of patients with the non-detected post-operative ctDNA (upper panel) showed clinical recurrence after median clinical follow-up of 15 (range 4–32) months. (g) Kaplan Meier disease free survival analysis was done over all patients with detected (n = 7) and non-detected (n = 12) post-operative ctDNA. Post-operative ctDNA detection shows association with shorter recurrence-free survival (RFS) (two-sided log-rank test).

