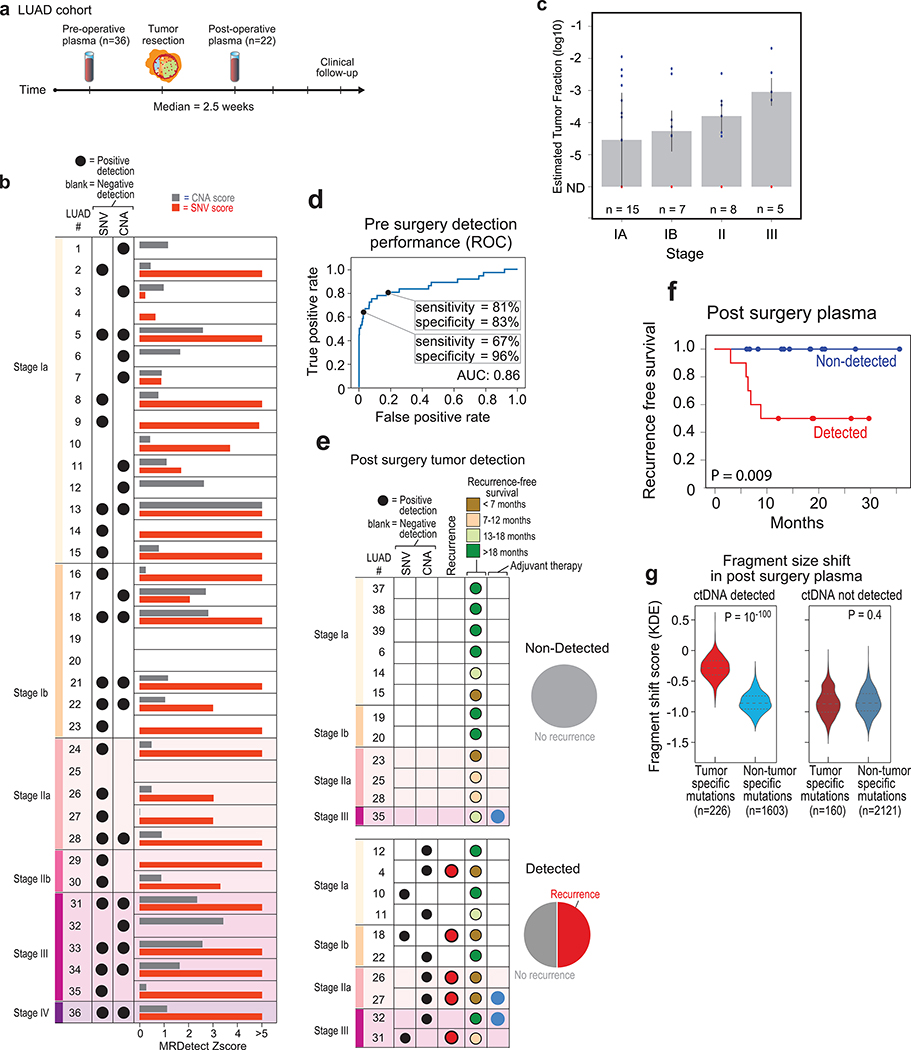
Figure 5: Detection of ctDNA using MRDetect in lung adenocarcinoma (LUAD) pre- and post-operative.
(a) Illustration of the LUAD clinical cohort and potential clinical utility for liquid biopsy residual disease detection post-operatively. Upon surgical resection of tumor, the primary tumor is sequenced to define the tumor mutational compendium. Pre-operative plasma is used to verify tumor mutational integration detection in cfDNA and establish detection performance metrics. Post-operative plasma (median 2.5 weeks) is used to establish the presence of residual disease. Patients with detectable ctDNA in their post-operative plasma samples show higher probability for disease recurrence even when there is no other clinical or imaging confirmation at that time. (b) Early stage lung adenocarcinoma (LUAD) detection on pre-operative plasma samples (n = 36 patients), using SNV (red) and CNA (gray) MRDetect methods. Z-score estimation (bar plots) was used to calculate the mutation signature detection in the patient plasma in comparison to detection in the control plasma test cohort (n = 30). Z-score was used for the SNV or CNA methods to define a positive tumor detection, indicated by black dots. (c) Early stage lung adenocarcinoma (LUAD) tumor fraction estimation per stage. All pre-operative plasma samples were considered for tumor fraction estimation by MRDetect, non-detected samples were assigned a 0 value. Bar plot represent the median TF value per stage, black line represents the confidence intervals (iqr) and the specific patient TF values are overlaid for the detected (blue dots) and non-detected (red dots) patients. Estimated tumor fraction shows association with cancer stage, with stage III samples showing the highest TF values. (d) Receiver operating curve (ROC) analysis on a combined detection model of SNV and CNA mutational compendia. Pre-operative plasma samples (n = 36) were used as the positive label, and the panel of control plasma samples against all patient mutational compendia (n = 1,080, thirty-six mutational compendia assessed across thirty control samples) was used as the negative label. Two operational points (Z-score thresholds) are shown that correspond with two different specificity regimes. (e) Detection of ctDNA post-operative (median 2.5 weeks after surgery) in plasma samples (n = 22) was performed using Z-score estimation in comparison to the cohort of control plasma test cohort (n = 30). Z-score was used for the SNV or CNA methods to define a positive tumor detection, indicated by black dots. Patients with clinical recurrence are indicated by red dots. Post-operative ctDNA detection (lower panel) is associated with early disease recurrence, as shown in the pie chart. None of patients with the non-detected ctDNA (upper panel) showed clinical recurrence after median clinical follow-up of 18 (range 6–36) months. (f) Kaplan Meier disease free survival analysis was done over all patients with detected (n = 10) and non-detected (n = 12) post-operative ctDNA. Post-operative ctDNA detection shows association with shorter recurrence-free survival (RFS) (two-sided log-rank test). (g) Fragments containing tumor mutations show fragment size shift in comparison to non-tumor (cross-patient) mutations in the same patient plasma. The fragment size shift was estimated on detected post-operative patients and non-detected post-operative patients using a kernel-density-estimation method (see Methods). Patients that showed ctDNA detection post-operative also exhibit significant shift (two-sample t-test) in their tumor-specific mutation detections in the patient plasma (light red, n = 226), compared to non-tumor (cross-patient) detected mutations on the same samples (light blue, n = 1603). Patients that do not show ctDNA detection post-operative also do not exhibit significant fragment size shift in tumor-specific mutation detections (dark red, n = 160) compared to non-tumor (cross-patient) detected mutations on the same samples (dark blue, n = 2121). Violin plots depict kernel density estimates of the density distribution. Center dashed lines represent the median and dashed lines represent the interquartile range.

