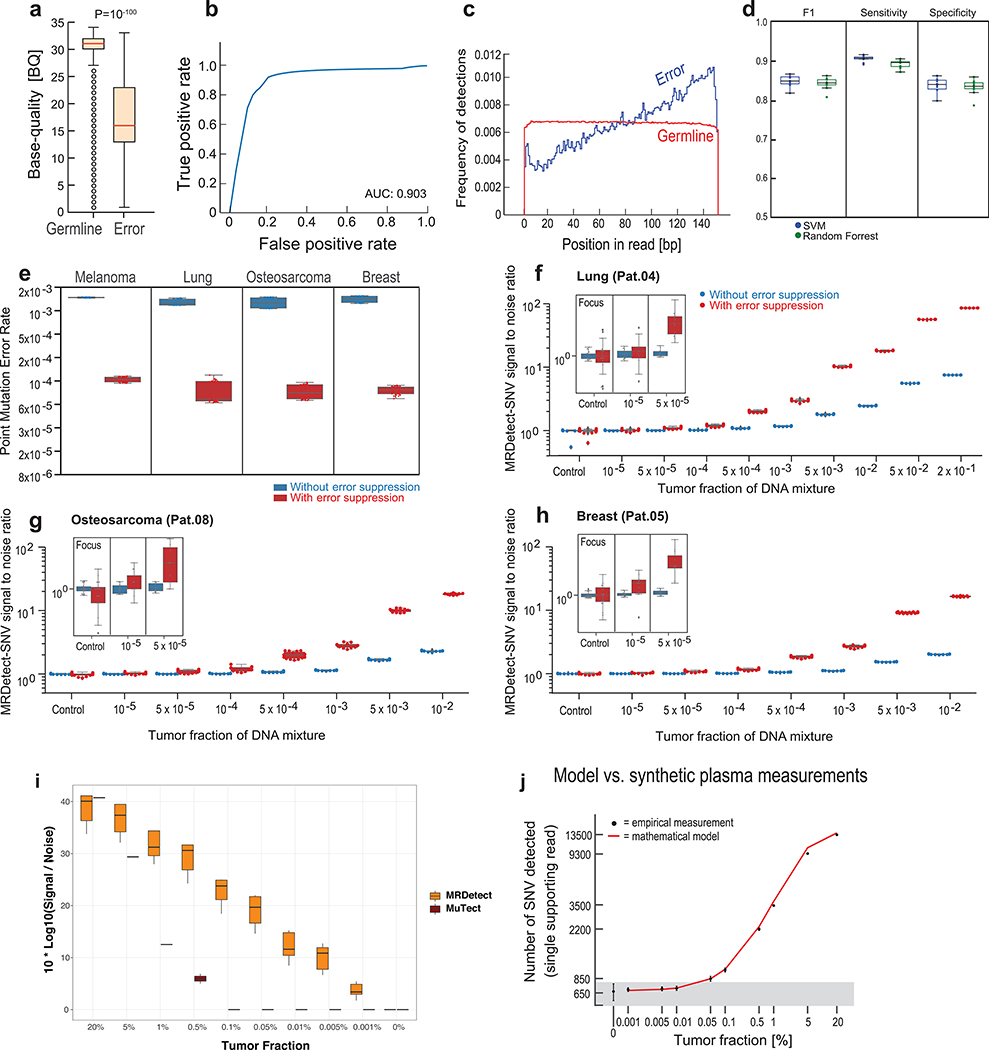
Extended Data Fig. 2. Patient-specific genome-wide SNV integration and error suppression.
a) Base quality (BQ) signal for high quality germline single nucleotide polymorphisms (SNPs; n = 9,142,326) vs. low VAF (single supporting read) artifactual variants (n = 407,061) from representative PBMC sample (Pat.01), showing distinct separation between SNP and the low VAF artifacts BQ distributions (P value < 10−100, two-sample t-test), and supporting effective filtration of sequencing artifacts by BQ filtration. (b) Receiver-operating-curve (ROC) analysis for BQ filtering including germline SNPs (true labels) and low VAF artifactual variants (false labels), using the same data set as in (a), and showing high filter performance for this simple quality metric (AUC = 0.9, n = 9,142,326). (c) Variant position-in-read (PIR) shows association between low VAF artifactual variants (n = 407,061) and position at the 3’ of the sequencing read, while germline SNPs (n = 9,142,326) show uniform spread across the sequencing read length. (d) Support vector machine (SVM) classification performance between germline SNPs (random subsampling, n = 100,000) vs. low VAF artifactual variants (random subsampling, n = 100,000) from all PBMC WGS data (n = 8). Performance of SVM and random forest classification was compared over the same sample set with 10-fold cross validation. (e) Box plot of error rate estimations before error suppression (blue) and after SVM-based error suppression (red) over four cancer types and 40 PBMC-derived replicates (2 patients per cancer type, 20 replicates per patient’s PBMC sample). Error rate was calculated as the number of mismatches detected over the number of bp checked. Showing a uniform error reduction (median 14 fold-change reduction, range 11–17). (f-h) Patient-specific SNV signal-to-noise quantification over a range of TFs (10−5-10−2) compared to basal noise signal detected in control (TF = 0, subsampled PBMC DNA fragments) samples (left column). Signal-to-noise was estimated by calculating the log difference between the number of detections in each plasma-like admixture (TF > 0) and the mean number of detections in the controls (TF = 0). Analysis was done separately using tumor and matched germline (PBMC) WGS from lung (f, Pat.04), breast (g, Pat.05) and osteosarcoma (h, Pat.08) patients. Inset panel shows discrimination of tumor and control samples down to tumor fraction 10−5 after utilizing machine-learning-based sequencing error suppression (red) vs. reduced sensitivity with the raw unfiltered data (blue). (i) Benchmarking of mutation detection performance for mutation centric method23 vs. read-centric method (MRDetect). Patient-specific SNV signal-to-noise quantification over a range of TFs (10−5-2X10⁻¹) compared to basal noise signal detected in control (TF = 0, subsampled PBMC DNA fragments) samples (right column). Signal-to-noise was estimated by calculating the log difference between the number of detections in each plasma-like admixture (TF > 0) and the mean number of detections in the controls (TF = 0). (j) Single nucleotide variant (SNV) point mutation detection in plasma mixtures with different tumor fractions (TF > 0) and controls (TF = 0) is shown. Y-axis shows the number of detections (variants observed in tumor WGS and also detected in plasma synthetic admixture) as a function of TF (x-axis). Red line constitutes the number of detections predicted for each TF based on the mutation load, coverage, noise model. Gray area represents the area under the background noise model threshold (1.5std), showing robust discrimination from noise for TF > 10-3. Analysis was done on 35X coverage lung cancer (Pat.04) admixture cohort. Centre values represent mean and error bars represent standard deviation. In (f-j), n = 11 independent admixture samples for TFs > 0 and n = 20 independently down-sampled PBMC replicates for the control (TF=0) of each patient. Throughout the figure, boxplots represent median, bottom and upper quartile; whiskers correspond to 1.5 x IQR.

