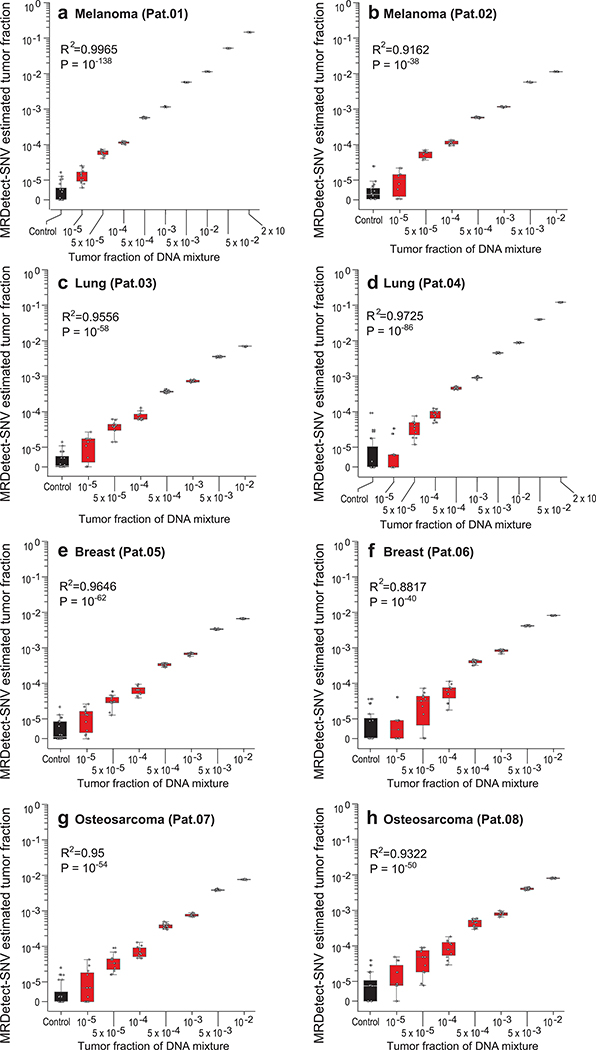
Extended Data Fig. 3. Patient-specific genome-wide SNV integration provides accurate read out of tumor fraction.
(a-h) Tumor fraction (TF) inference plots using MRDetect genome-wide SNV integration for two melanomas (a: Pat.01, b: Pat.02), two lung cancers (c: Pat.03, d: Pat.04), two breast cancers (e: Pat.05, f: Pat.06), and two osteosarcomas (g: Pat.07, h: Pat.08). Each plot was generated using in silico admixtures of varying TF (range 10−5-0.2) with 35X depth of coverage by randomly downsampling and mixing tumor reads (mean coverage 97X, range 85X-110X) and germline reads (mean coverage 49X, range 43X-56X) from WGS data (see Methods; Supplementary Table 1). For TFs > 0, n = 11 independent admixture samples. For the control (TF = 0), n = 20 independently down-sampled PBMC replicates. We observed accurate TF estimation as low as 10−5, discriminated from control (TF = 0) samples (left box-plot), with high Pearson correlation (two-sided test) between the input TF mixture (x-axis) and the SNV-based estimated TF prediction, confirming accurate inference based on genome-wide mutational integration. Throughout the figure, boxplots represent median, bottom and upper quartile; whiskers correspond to 1.5 x IQR.

