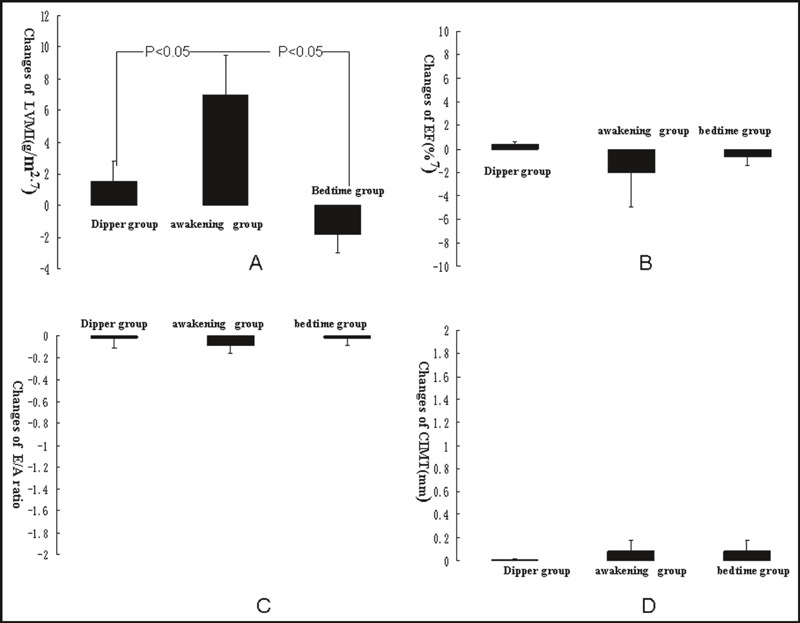
Figure 3.

Comparison of ultrasonography parameters after valsartan therapy in the three groups. (A) Changes in left ventricular mass index after valsartan therapy in the three groups. (B) Changes in left ventricular ejection fraction after valsartan therapy in the three groups. (C) Changes in E/A ratio after valsartan therapy in the three groups. (D) Changes in carotid intima‐media thickness after valsartan therapy in the three groups.
