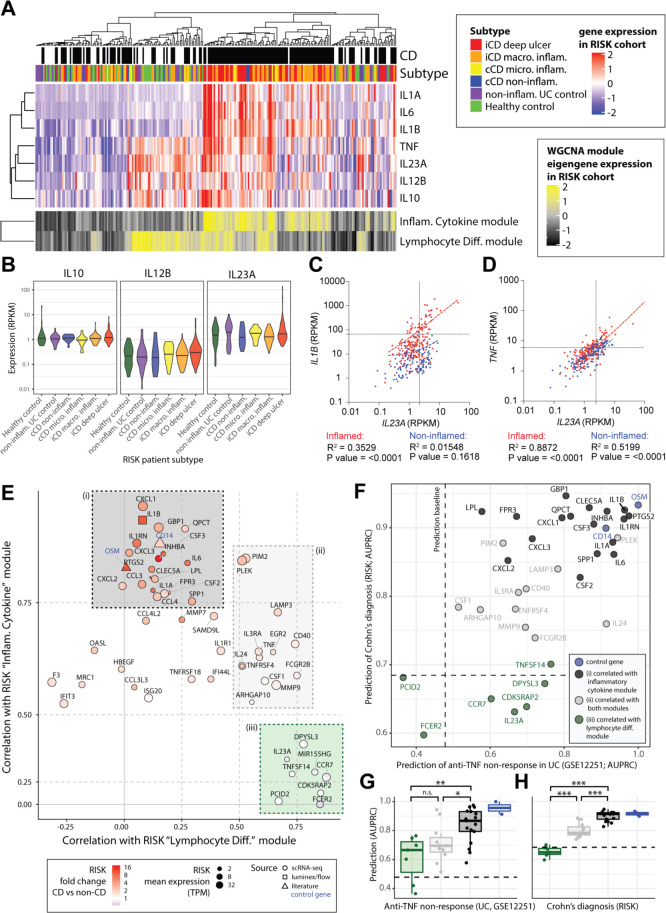
Figure 4.
An IL-10-regulated inflammatory monocyte gene signature informs IL-23 and IL-1 targeting therapeutic approaches in IBD. (A) Patients of the RISK cohort (diagnosis and subtype as shown in top panels) were clustered according to the expression of 22 modules of coexpressed genes (see online supplemental figure 7A). The upper heatmap shows expression of key cytokines across the cohort. The lower panel shows expression of the eigengenes of two of the identified modules of coexpressed genes. (B) The expression of IL10, IL12B and IL23A within the different patient strata of the RISK cohort. (C, D) Correlation of IL23A with IL1B (C) and IL23A with TNF (D) in the inflamed (red) and non-inflamed (blue) CD patient biopsies of the RISK cohort. (E) Correlation of genes specific to LPS and anti-IL-10R-stimulated monocytes with the ‘inflammatory cytokine’ and ‘lymphocyte differentiation’ gene modules in the RISK cohort data identifies three subsets (shaded (i) black, (II) grey and (III) green boxes). (F) Assessment of the ability of the identified monocyte genes to predict anti-TNF non-response (x-axis, GSE12251) and diagnosis of Crohn’s (y-axis, RISK cohort). The dashed lines indicate random classifier performance. (G, H) Comparison of the ability of the identified subsets of monocyte genes to predict TNF non-response (GSE12251) and diagnosis of CD in the RISK cohort (Wilcoxon tests, colours as shown in panels E, F). AUPRC, area under precision recall curve; CD, Crohn’s disease; IL, interleukin; LPS, lipopolysaccharide; n.s., not significant; RISK, Risk Stratification and Identification of Immunogenetic and Microbial Markers of Rapid Disease Progression in Children with Crohn’s Disease study; TNF, tumour necrosis factor; WGCNA, weighted gene correlation network analysis. *pvalue<0.05, **pvalue<0.01, ***pvalue<0.001, ****pvalue<0.0001.

