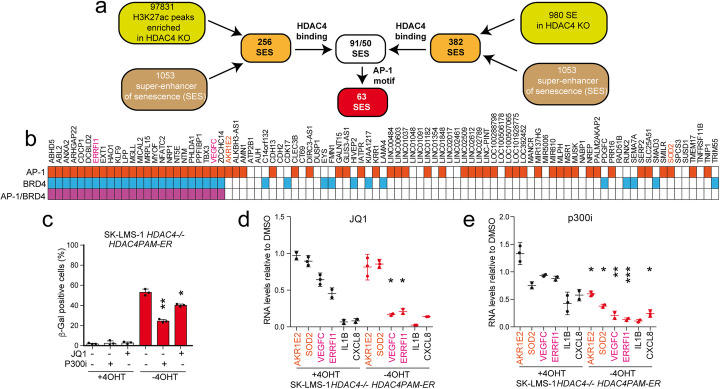
Fig. 5.
Several SES bound and regulated by HDAC4 are targets of AP-1 and p300. a The flow chart summarizes the screening procedure adopted to evaluate SE and TE regulated by HDAC4 and characterized for AP-1 binding motifs in senescence. b 91 HDAC4-bound and regulated SES were ordered according to the reported binding by AP-1 [9] (red squares), BRD4 [4] (blue squares), or both (violet squares) during senescence. AKR1E2 and SOD2 (in red) and VEGFC and ERRFI1 (violet) were selected respectively as representative BRD4-independent and BRD4-dependent AP-1 and HDAC4 regulated SES. c Analysis of SA-β-gal positivity in SK-LMS-1 HDAC4−/− cells, re-expressing (+ 4-OHT) or not (− 4-OHT) HDAC4-ER for 24 h prior to the treatment for 48 h with JQ-1 (0.5 μM) or 3 μM of A-485 (p300i), as indicated. Mean ± SD; n = 3. The significance is relative to untreated cells not re-expressing HDAC4. d mRNA expression levels of the indicated genes after treatment with JQ-1, as explained in c. For the two groups of KO cells re-expressing or not HDAC4, the fold induction is relative to the matched DMSO-treated cells. The significance is relative to the comparison between the two groups re-expressing or not HDAC4 and treated with the same drug. e mRNA expression levels of the indicated genes after treatment with p300i, as explained in c. For the two groups of KO cells re-expressing or not HDAC4, the fold induction is relative to the matched DMSO-treated cells. The significance is relative to the comparison between the two groups re-expressing or not HDAC4 and treated with the same drug

