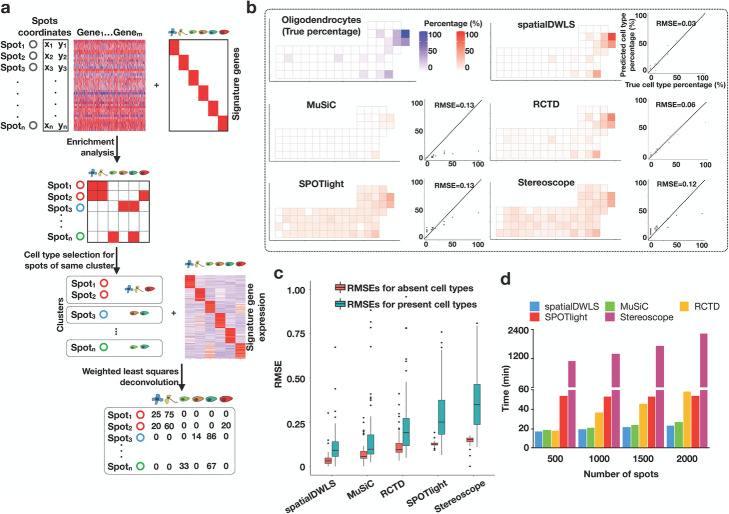
Fig. 1.
An overview of the spatialDWLS method. a A schematic representation of the spatialDWLS workflow. The input contains a spatial transcriptomic dataset (gene expression matrix and cell location coordinates) and a set of known cell-type specific gene signatures. For each spot, the cell types that are likely to be present are identified by using cell-type enrichment analysis. Then, a modified DWLS method is applied to infer cell type position at each spot. b Comparison of the accuracy of different deconvolution methods. Single-cell resolution seqFISH+ data are coarse-grain averaged to generate lower-resolution spatial transcriptomic data. The true frequency of a cell-type (indicated as blue squares in the top left panel) at each spot is compared with the inferred frequency (indicated as red squares in the five other panels) by using different methods. The relationship is also represented as a scatter plot, with x-axis representing the true frequency and the y-axis representing the inferred frequency. The overall performance is quantified as the root mean square error (RMSE). The oligodendrocyte cell-type is used here as a representative example. c The overall RMSE error is further decomposed into two components, corresponding to regions where the cell type is absent (red) and present (green), respectively. d Comparison of the computing speed of different methods. Running times for analyzing a mouse brain Visium dataset are shown

