
Figure 1.
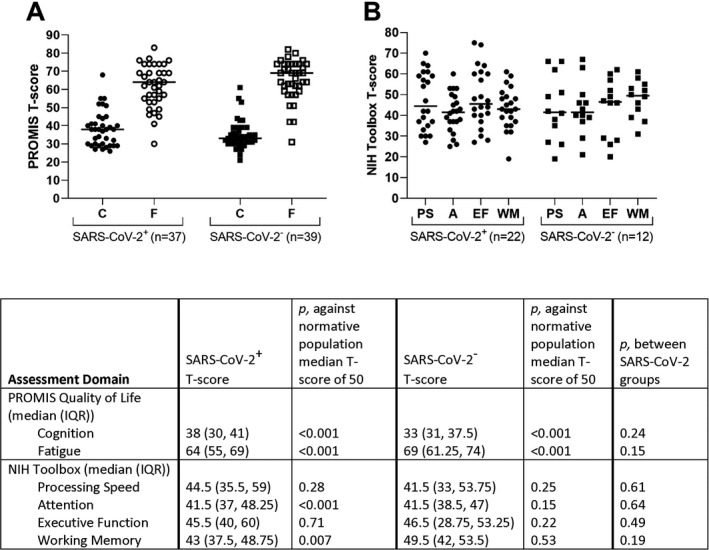
Patient‐reported outcomes measurement information system (PROMIS®) quality of life and NIH Toolbox cognitive assessments demographic‐matched T‐scores in SARS‐CoV‐2+ (circles) and SARS‐CoV‐2‐ (squares) individuals. A T‐score of 50 is the mean/median for the demographic‐matched United States normative population with a standard deviation of 10. (A) PROMIS® cognitive function (C, filled symbols) and fatigue (F, empty symbols) assessments. Lower cognition scores indicate worse cognition quality of life and higher fatigue scores correspond to worse fatigue quality of life. Patient group median values are represented by horizontal bars. (B) NIH Toolbox assessments for processing speed (PS), attention (A), executive function (EF), and working memory (WM). Median values are represented by horizontal bars. One‐sample Wilcoxon signed‐rank test p‐values between patient group T‐scores and the demographic‐matched normative US population median of 50 are provided in the figure table.