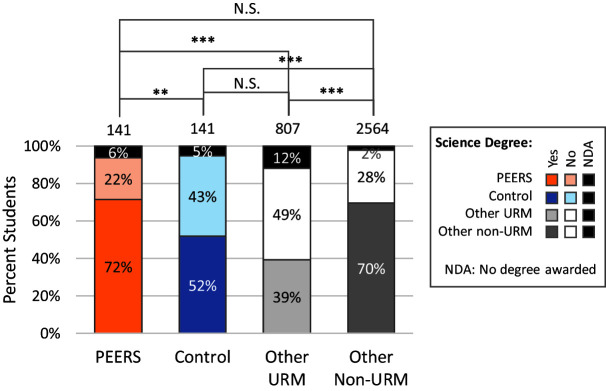
FIGURE 3.
Degree completion rates by comparison groups. Colors as shown in the legend indicate completion of a science degree (Yes), non-science degree (No), or no degree at the time of data collection (NDA). Numbers on top of bars indicate sample group size. Pairwise comparisons for students with degrees awarded between groups were conducted using a chi-square test; significance values are indicated (see also Supplemental Table 5). **p < 0.01; ***p < 0.001; N.S., not significant.

