
FIGURE 4:
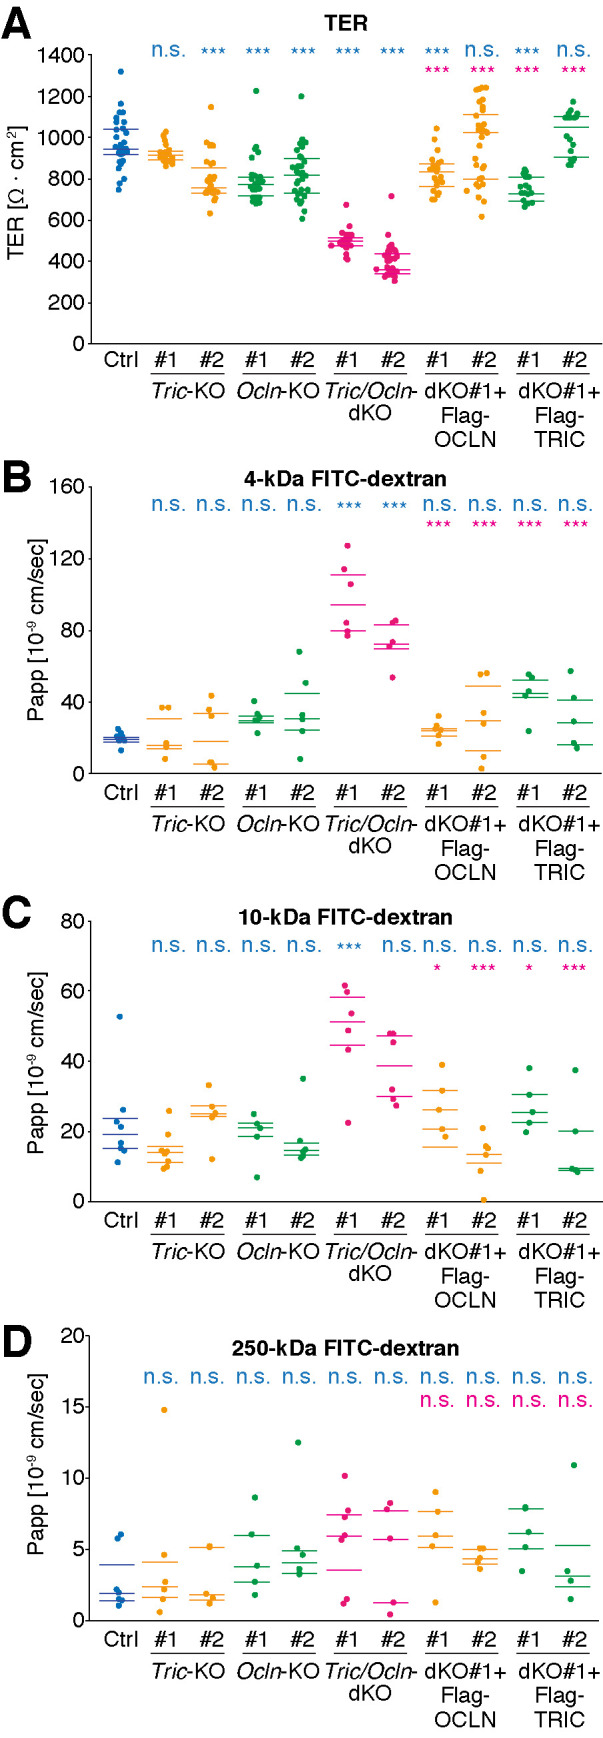
Loss of tricellulin and occludin leads to increased permeability of ions and macromolecules. (A) TER of Ctrl, Tric-KO, Ocln-KO, Tric/Ocln-dKO, dKO #1+Flag-OCLN, and dKO #1+Flag-TRIC cell sheets was measured on day 5 after seeding onto the filter cups. Two independent clones for each genotype were analyzed (#1 and #2). n = 17–35. (B–D) Apparent permeability (Papp) of 4-kDa (B), 10-kDa (C), or 250-kDa (D) FITC-dextran through Ctrl, Tric-KO, Ocln-KO, Tric/Ocln-dKO, dKO #1+Flag-OCLN, and dKO #1+Flag-TRIC cell sheets was measured on day 8 after seeding onto the filter cups. n = 4–8. 25; 50, and 75 percentiles are shown (lines). *p < 0.05; ***p < 0.001; n.s., p ≥ 0.05 in the Tukey–Kramer test. Top and bottom rows indicate the comparison with Ctrl cells (cyan) and Tric/Ocln-dKO #1 cells (magenta), respectively. The p values in Tukey–Kramer test are shown in Supplemental Table S1.