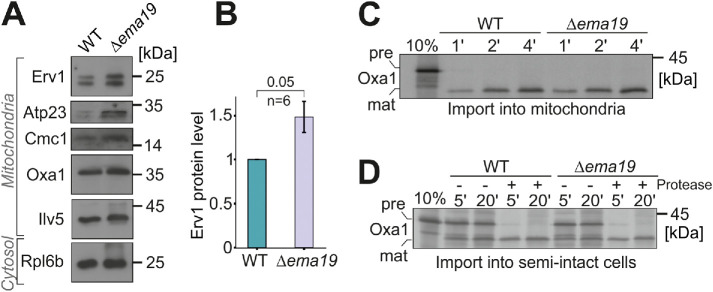
FIGURE 4:
Δema19 cells show increased levels of Erv1. (A, B) The levels of the indicated proteins in whole cell extracts were analyzed by Western blotting. (C, D) Radiolabeled Oxa1 was incubated with isolated mitochondria or semi-intact cells for the times indicated. Samples were treated with protease and analyzed by SDS–PAGE and autoradiography; pre, precursor; mat, mature.

