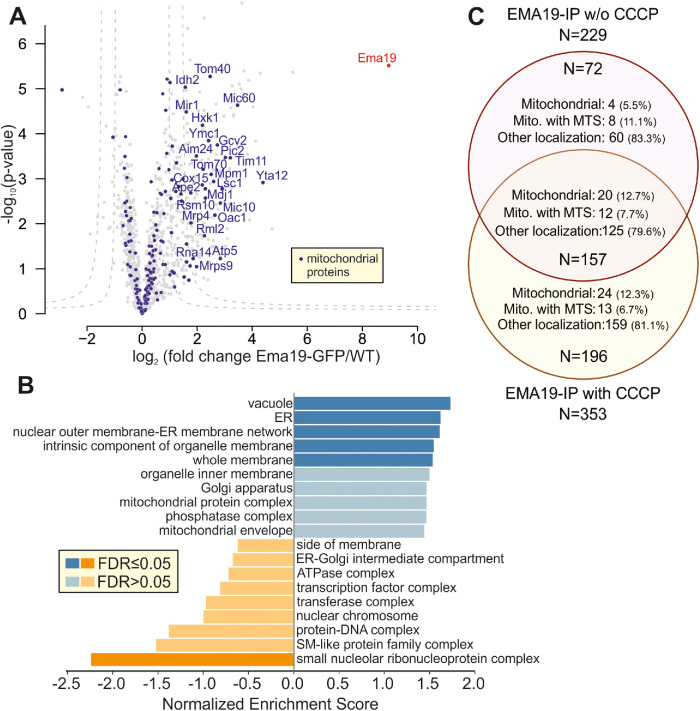
FIGURE 5:
Ema19 interacts with many membrane proteins of the ER, vacuole, and mitochondria. (A) Ema19-GFP and WT cells were grown on glucose medium to mid-log phase, harvested and washed. Cells were lysed with glass bead lysis using NP40 as mild detergent. Extracts were cleared by centrifugation and incubated with GFP-Trap beads before bound proteins were analyzed by mass spectrometry. Data are based on four biological replicates for each strain. Enriched proteins are found in the upper right corner of the graph. Significant enrichment was tested with a two-sided t test with permutation-based FDR cut-off to correct for multiple testing (S0 = 4, FDR < 0.05 or FDR < 0.01). (B) Ema19-GFP interactors were analyzed using the WEB-based GEne SeT AnaLysis Toolkit algorithm (Liao et al., 2019) and gene ontology groups are shown which are frequently found with Ema19 (in blue) or which are underrepresented (in orange). (C) The mitochondrial membrane potential influences Ema19 interactions. Cells were treated for 1 h with the uncoupler CCCP to dissipate the mitochondrial membrane potential before cells were harvested and lysed with NP40. Ema19-GFP was isolated and interactors were determined by mass spectrometry. The full dataset is shown in Supplemental Table S5. Venn diagram showing proteins that were significantly enriched in the Ema19-GFP pull-down under the different conditions (S0 = 4, FDR<0.05). Mitochondrial localization according to Morgenstern et al. (Morgenstern et al., 2017); MTS, mitochondrial targeting sequence.

