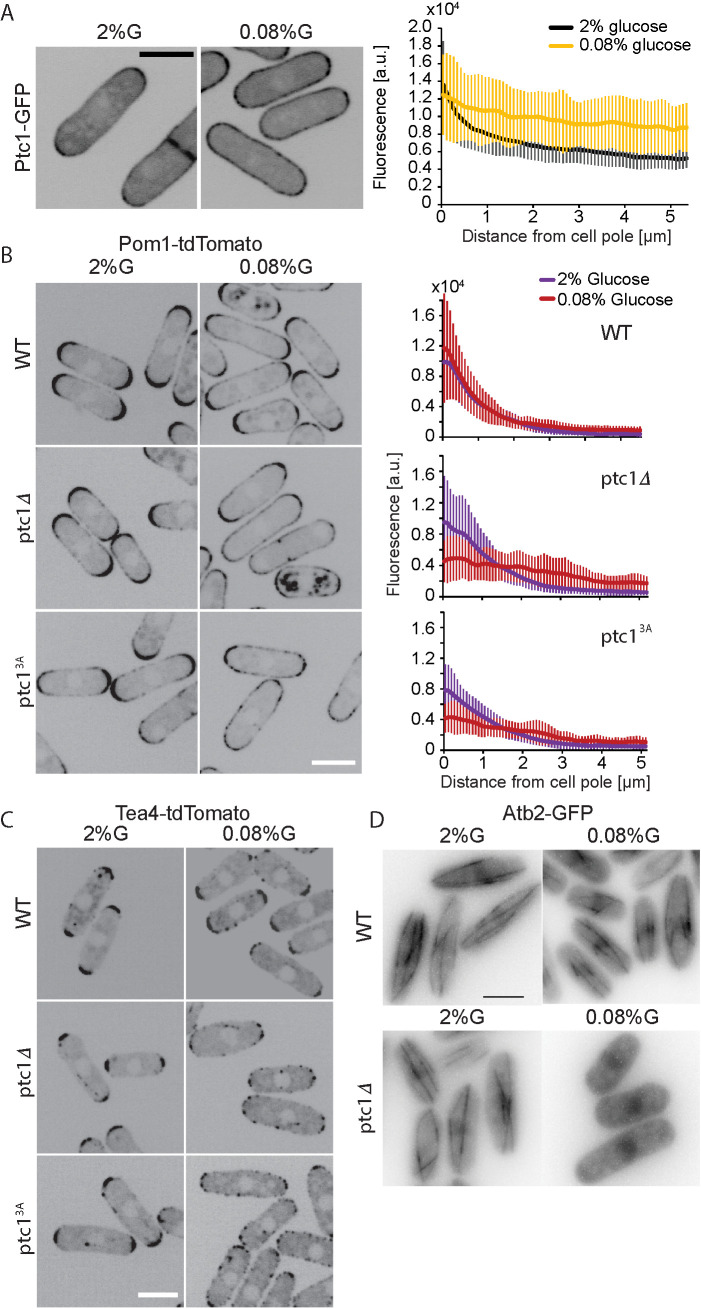
FIGURE 4:
Ptc1 keeps Pom1 from spreading to the cell sides in limited glucose conditions. (A) Localization of Ptc1-GFP in EMM-ALU 2% glucose and 0.08% glucose. Graph on right shows average profiles of wild-type Ptc1-GFP from n = 20 cells. Individual profiles are shown in Supplemental Figure S4B. Error bars are standard deviations. (B) Localization of Pom1-tdTomato in wild type, ptc1∆, and ptc13A-GFP (GFP not shown). Graphs on the right show average fluorescence profiles of Pom1-tdTomato obtained from individual cells (n = 20). Error bars are standard deviations. (C) Localization of Tea4-tdTomato in wild-type, ptc1∆, and ptc13A-GFP backgrounds (GFP not shown). (D) Atb2-GFP signal in wild-type and ptc1∆ backgrounds. Widefield microscopy. The indicated time is the exact time point during the imaging interval. In all panels, cells were grown in 2% glucose (G) for 24 h and shifted to 0.08% glucose for 1 h before imaging. In A–C, images are sum projections of five confocal images acquired over time. In D, the images shown were taken 1 h 30 min (top) and 1 h 10 min (bottom) after transfer to 0.08% glucose. Scale bars: 5 µm.

