FIGURE 3:
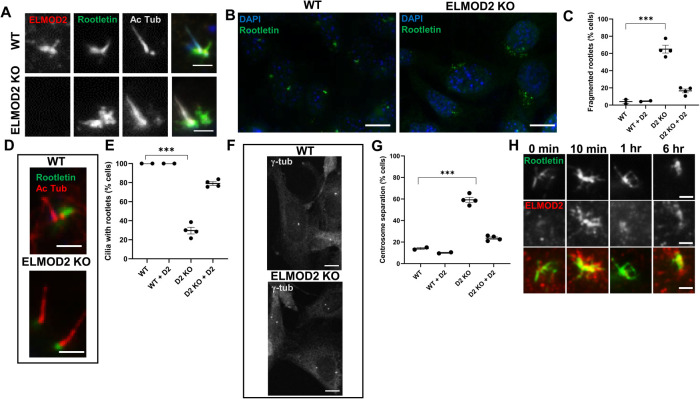
ELMOD2 localizes to rootlets, and its deletion causes rootlet defects. (A) ELMOD2 localizes to rootlets in WT MEFs. WT or KO cells were fixed for 5 min in ice-cold methanol and stained for ELMOD2, acetylated tubulin, and Rootletin, as described under Materials and Methods. Images were collected via wide-field microscopy at 100× magnification. Scale bar = 10 µm. (B, C) ELMOD2 KO cells have increased rootlet fragmentation. Serum-starved, methanol-fixed cells were stained for Rootletin and Hoechst. Images were collected using wide-field microscopy at 100× magnification and (C) scored in duplicate for fragmented rootlets. (D) Rootletin staining in ELMOD2 KO cells is limited to the base of cilia and is more condensed than in WT cells. Growth and fixation conditions were the same as in B. Cells were stained with Rootletin and acetylated tubulin (to mark cilia). Images were collected via wide-field microscopy at 100× magnification. (E) The same conditions as described for C were used to score cell lines for cilia with rootlets. Only ciliated cells were scored. (F) ELMOD2 KO cells show increased centrosome separation. Serum-starved cells were fixed with ice-cold methanol, stained for γ-tubulin, and imaged via confocal microscopy at 100× magnification, with z-projections. Scale bar = 10 µm. (G) Using the same conditions as described in B, cells were scored for centrosome separation using FIJI image processing software with the provided measuring tool. Cells were counted as “separated” if they were more than 2 µm apart. (H) ELMOD2 and Rootletin staining both change after serum starvation. WT MEFs were fixed at different times after serum starvation and stained for ELMOD2 and Rootletin. Representative wide-field images were collected at 100× magnification. Staining of each at basal bodies is strongly increased within 10 min, showing extensive overlap. At later times each becomes more concentrated into a smaller area, but filamentous staining of ELMOD2 is lost before that of Rootletin. When scoring was performed, the average of duplicates of individual lines was plotted using an interleaved scatterplot. Error bars indicate SEM. Statistical significance was assessed using one-way ANOVA; *** = p < 0.0001.

