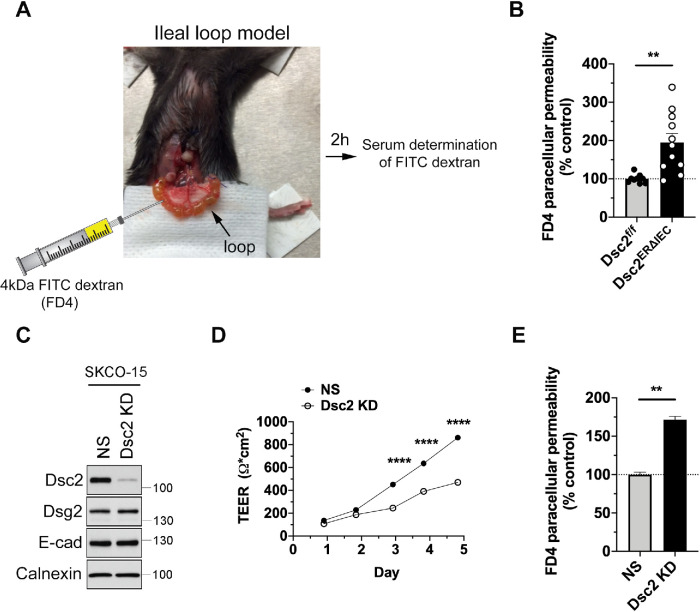
FIGURE 3:
Loss of Dsc2 resulted in epithelial barrier dysfunction in vivo and in vitro. (A) Image of the ileal loop model used to quantify intestinal epithelial permeability to 4-kDa FITC-dextran in vivo in Dsc2ERΔIEC mice vs. Dsc2f/f controls. A 4-cm length of ligated ileal loop was exteriorized without disruption of blood supply following which a solution of 4-kDa FITC-dextran was administrated into the intestinal lumen. The ileal loop was placed back in the peritoneal cavity and at 2 h postinjection of FITC-dextran; serum concentrations of FITC were determined at 488 nm using a microplate spectrophotometer. (B) Dsc2 depletion resulted in increased intestinal permeability to 4-kDa FITC-dextran in vivo. Histograms show the mean ± SEM and points represent values from an individual mouse (9–11 mice per group). Data are combined from two independent experiments. Significance is determined by two-tailed Student’s t test. **p < 0.01. (C) Expression of Dsc2 in protein lysates from SKCO-15 cells transduced with shRNA-induced KD of Dsc2 (Dsc2 KD) was compared with nonsilencing shRNA control cells (NS). Western blot images are representative of at least three individual experiments and show KD of Dsc2, whereas the expression of E-cadherin and Dsg2 was unchanged. Calnexin was used as loading control. (D) TEER of cell monolayers from SKCO-15 Dsc2 KD cells vs. NS control was determined every day after cell seeding for 5 d. At day 5, TEER was reduced by twofold in SKCO-15 Dsc2 KD cells in comparison with control. Results show the mean ± SEM and are representative of four individual experiments, each one assayed in four technical replicates. Statistical analysis was done with two-way ANOVA, followed by Tukey´s posttest. ****p < 0.0001. (E) Paracellular flux of 4-kDa FITC-dextran across cell monolayers from SKCO-15 Dsc2 KD and NS control cells. FITC-dextran flux was significantly increased in SKCO-15 Dsc2 KD cells. Results show the mean ± SEM and are representative of four individual experiments, each one assayed in four technical replicates. Statistical analysis was done with two-tailed Student’s t test. **p < 0.01.

